
Interest Rate Swaps As a Benchmark - Bookending the End of An Era
02/09/2016
This document is subject to the Disclaimer in the Disclaimer Page linked above. Please read the Disclaimer in it's entirety.
Summary
I have championed the use of Interest Rate Swaps ("IRS") as a benchmark for valuation of Fixed Rate Bonds (especially MBS) since 1990, and have written about this topic numerous times. Two recent articles discussing the current negative swap rates piqued my interest and compelled me to revisit and re-research this market.
In January 2016, PIMCO published a Viewpoint on their website - ‘Finding Sea Level for Interest Rates’ by Harley Bassman. Bloomberg subsequently reported on this in an article titled ‘Pimco Asks If Swap Rates Could Be the New Risk-Free Benchmark for Bonds’ dated 1/27/2016 by Tracy Alloway and Liz McCormick. Both articles raise some interesting questions that I will attempt to answer.
This document reviews my methodology for determining the factors that impact IRS and their relationships to other bond markets, using many examples from my past publications. I use my methodology to discuss the history of interest rate swap movements in the 2000s. I then assess the recent past to form my opinions about the current negative Interest Rate Swap spread levels, benchmarking, and other factors that impact or might be of interest to financial market participants.
My conclusions
- Swaps are less effective as a benchmark than they used to be, and hedging with swaps seems to have more risk than hedging with USTs.
- I would not use Interest Rate Swaps as a benchmark for Fixed Income valuation any more.
- Negative Swap Spreads tell us that Treasuries are cheap.
- Swaps are now an instrument with which to bet on QE-related Central Bank activity and flows.
- Swaps spreads can go more negative if central banks sell more of their UST holdings.
- Swap spreads will widen again if we get more UST purchases from further Central Bank QE. I believe we will see more easing via the Fed's Balance Sheet at least.
- The world of a single benchmark curve for valuing Fixed Income is ending.
Questions Raised
- Is the increased risk and reduced correlation of IRS with Fixed Income asset spreads creating a negative feedback loop and increasing global volatility?
- Is Zero the correct and new Benchmark?
2/12/16 - New analysis on 10yr CMBS, showing that Swaps do not work anymore as a good hedge or benchmark. Page down to the section before the conclusion.
Framework for Understanding the TED Spread and Swap Spreads
Hopefully most people reading this know what swaps are and how they work, so I won’t go into much detail on the mechanics or terms. Please contact me if you need more detail – the descriptions in the next few paragraphs are brief.
TED stands for EuroDollar Futures minus Treasury Futures yield spread, and can also be traded as a single futures contract instead of a long ED and a short T-bill contract. The TED Spread defines the short term LIBOR spread to USTs. One of the ways LIBOR is traded is in the Eurodollar Futures markets, where different maturity futures are available.
Interest Rate Swaps are contracts with banks to change the duration of LIBOR (ie the TED spread), from a short term rate (overnight, 1 month, 3 month, 1 year) to a longer term (2yr, 5yr, 10yr, 30yr). So Swap Spreads are spreads to Treasuries with matched cashflow dates.
Since futures are traded as discount contracts and cannot match the semi-annual coupons payments of most bonds without resorting to baskets of ED futures, IRS are used by many investors instead to match the cashflows and durations of their hedges with those of their assets. Custom IRS can also be created by banks to match MBS monthly amortization and cashflows ("mortgage swaps"). Swap traders in turn use strips of Eurodollar and Tbill futures to hedge their IRS books. So Swaps resemble synthetic levered bonds positions – long semi-annual interest bearing bond of a defined maturity, with short LIBOR funding (called being Long a swap instead of a bond), or vice versa (Short a swap).
My framework to understanding spreads is quite simple: identify the marginal buyer and seller of each side of the transaction, and their flows, hurdle rates and funding costs. Their demand and supply flows will determine movements and trends in spreads. Their cost structures or hurdle rates will determine the target net spread. This generalized framework can apply to most markets, but also to IRS spreads.
To understand the factors that impact the TED spread, and thus IRS spreads, please refer to TED spread section from the Merrill Lynch Fixed Income Research booklet, ‘An Analytical Guide to Understanding Futures Spreads' that I authored in 1988.
The table below summarizes the factors that I identified at the time. These concepts can be generalized and do not envelop all possible determinants of the TED or LIBOR spreads.
Factors Affecting the TED Spread
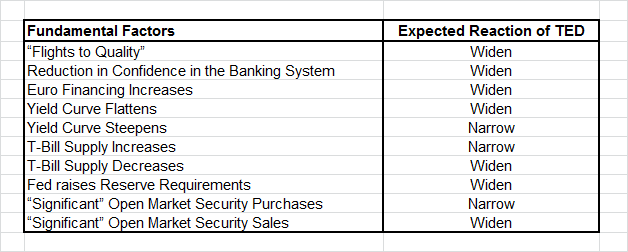
By analyzing such factors when asking questions such as “why are swap spreads too tight”, “why are swap spreads negative”, or “will swap spreads widen”, you will likely be able to answer your inquiry, or at least gain some insight into the forces driving the market.
One might also discover that Swap spreads do not have magical movements that one must react to. Like all market driven prices, their prices too are driven by demand and supply. By following the demand and supply of Treasuries and private securities, and by identifying the marginal participant, in many cases one can model and predict swap spreads. This in turn allows one to make predictions on future securities valuations and relative value between sectors.
“PIMCO Asks If Swap Rates Could Be the New Risk-Free Benchmark for Bonds”
LIBOR and Term LIBOR (aka Interest Rate SWAPs) have been broadly accepted as the primary benchmark for asset valuation by the buy-side for many years, gradually starting in 1998, after the Russian and LTCM Crises demonstrated the folly of hedging with Treasuries. A number of buy-side accounts that I am aware of were using it as early as the late 1980s, especially if they worked at banks or had managed money for banks.
In November 1990, I wrote a Morgan Stanley MBS Research article on using Swaps Spreads to value MBS – probably the first publication ever on the topic - titled ‘Hedging Costs Can Drive MBS Relative Value’ – in which I introduce the concept of Hedged Spreads and using duration matched swaps for valuation of MBS. This is now known as LIBOR OAS. This insight came to me when I worked closely with a bank, to help restructure and save it from the RTC (Anchor Savings Bank).
In this article, I created a measure I called Hedged Spread (that is now commonly called LIBOR OAS). At the time (Exhibit 1), MBS OAS (using the Treasury curve as was the norm at the time) was very stable, around 75bps. However, swap spreads had tightened (Exhibit 2), especially relative to MBS OAS (Exhibit 3) and MBS Hedged Spreads had widened (Exhibit 6). I identified the reason for this as increased rates of MBS selling from depository institutions (due to the S&L Crisis, requiring them to raise capital ratios by shrinking their balance sheets). I predicted that this would “..raise their hurdle rates for MBS Investments and creates a substantial risk of greater MBS Supply. Further mortgage and hedged spread widening might occur...MBS investors should heed these trends determining MBS value when timing their investments.”
In that 1990 article, I state “The true marginal cost of long-term funds is, therefore, a combination of the short-term funds spread to LIBOR and the swap rate...The swap spread...can then serve as a proxy for the marginal relative cost of duration-matched funds.”
However, by naming the arbitrage spread in a general manner as a "Hedged Spread" and concluding that “There is a strong relationship between MBS value and the costs of funding these assets”, I made a prescient case to follow the marginal buyer or funder of assets to determine value and prices, something I continue doing.
There will be times when the marginal buyer or seller will not be benchmarked to LIBOR, complicating the usage of Swaps as a relative value benchmark. However, by identifying the participants and following their funding costs and hurdle rates, one can make recommendations and decisions about many different types of assets.
Almost all buy-side firms (at least in MBS and CMBS) transitioned from using Treasury-based benchmarks to a LIBOR (or swaps)-based framework in the late 1990s, with broad acceptance by the 2000s. Bloomberg, for decades now, has allowed you to change the benchmark for yield tables, OAS calculators, and other pages, and most MBS market participants have long since changed their defaults to the I52 or S23 curves.
The large exception to using swaps for hedging and benchmarking, in my experience, has been large Wall Street Trading and possibly ‘Prop’ desks, for a very rational reason: their desk P&L also (possibly largely) consists of Carry, and using Swaps (instead of Treasuries) to hedge would reduce the carry component of their reported P&L, since they would be shorting (or be measured against) a higher yielding instrument. I know this from experience - when I proposed this to some trading desks, they were adamantly opposed to using swaps to hedge their positions, even when I showed them the data to show that it could reduce risk. I was once told candidly by a senior trader that the real job was trading the hedges, not the assets on the balance sheet.
History of Swap Spreads
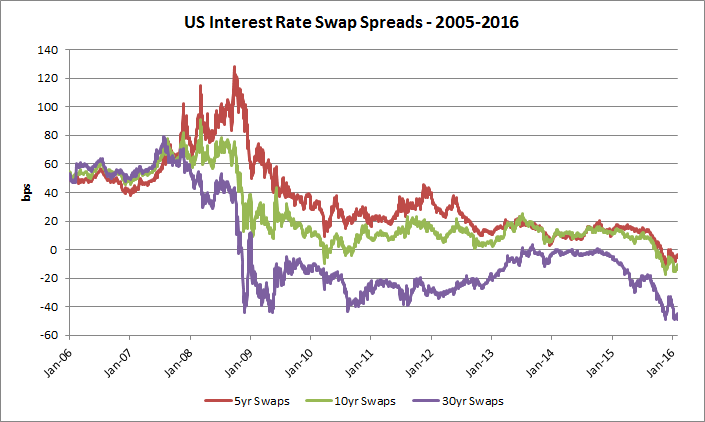
The next graphs shows that swap spreads came down from highs in 1990-1991 to a period of relative stability till 1997, when they started widening, with spikes in 1997/1998 (Thai/Asian/LTCM/Tiger blowups), post-9/11 highs, and then coming back down during the 2000s. They widened again during the buildup to the Great Financial Crisis (“GFC”) of 2007/2008, and are now subsequently taking turns to go negative.
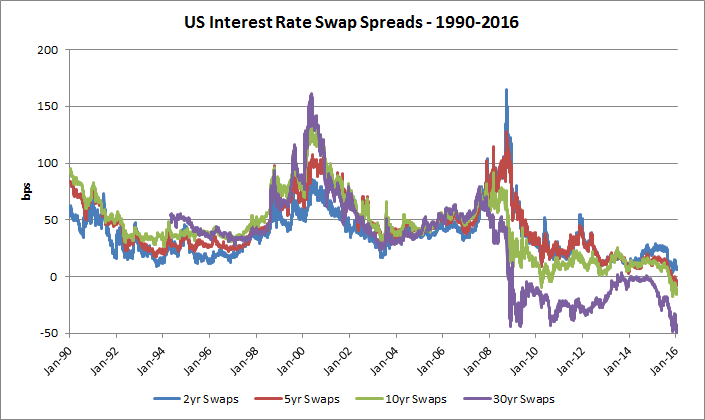
Source: Bloomberg, MBS Mantra, LLC.
Liquidity of Longer Swaps
It was my understanding that the 30yr IRS is mostly a quoted number, with very few transactions occurring in this instrument, although this might be different now. Eurodollar futures do go out to 2025, with decreasing liquidity, which means that at least you can arbitrage a bad 10yr swaps or shorter swap quote (to an extent). So 10yrs and shorter-tenor swaps spread quotes should be reasonably close to reality. (See the EDS and EDSF pages on Bloomberg.)
Most swap contracts longer than 10 years are customized by banks for the needs of the issuer or owner of a bond, and can have a host of options – they can be dual currency, or can be paid coupons on the total return of an index or a commodity, or be callable, etc. It is quite likely that the standard 30yr swap rate is nothing more than a quote for a contract that does not really exist in any size.
However, it can serve as a relative benchmark, and can allow demand and supply movements in the shorter swap spreads to be more apparent. For that reason, I will be discussing the movements in 10yr swap spreads and comparing them to their 30yr counterparts.
1990-2000
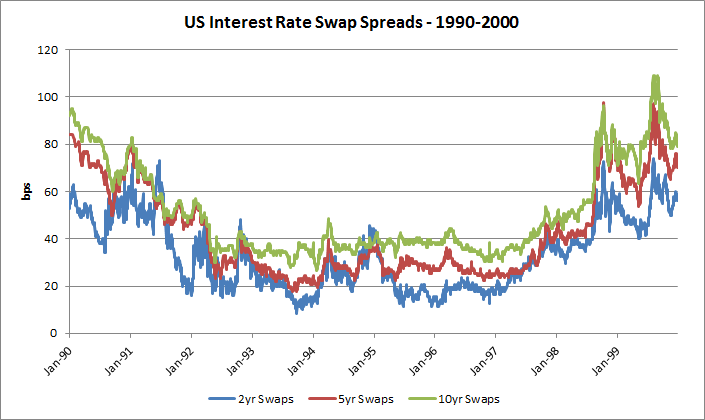
Source: Bloomberg, MBS Mantra, LLC.
I should note that during the early 1990s, I was the ARMs analyst, Non-Agency MBS analyst, and bank regulatory specialist within MBS Research at Morgan Stanley, and had been intimately involved with restructuring both sides of Anchor Savings Bank’s balance sheet to help it improve its capital position, teaching me a lot about costs of funds and bank interest rate margin management. My wide range of responsibilities gave me a broader perspective of inter-market linkages than enjoyed by most other market participants.
a
Identifying the originators of flows on each side of the TED equation during this period led to some pretty interesting insights which I wrote about at the time.
- * MBS LOAS widening due to increased MBS selling in 1990-1991 from the S&L crisis
- * Increased T-Bill issuance to fund the RTC thrift bailout tightened swap spreads in 1991, which led me to a prediction of tight swap spreads for a few more years
- * Widening of swap spreads in 1997 in response to President Clinton's decision to finally reduce T-Bill issuance, unwinding the supply that had been created to fund the RTC's balance sheet.
- * When MBS tightened in 1993 due to FNMA's portfolio purchases (FNMA became the marginal buyer), I followed FNMA's debt issuance and cost of funds to determine relative value in MBS - Agency OAS in other words.
- * Identifying a rich Agency ARMs market in 1992 using LIBOR OAS. As a result, I cautioned clients against starting any LIBOR Plus funds utilizing ARMs since they were too rich and unlikely to provide the desired returns.
- * Identifying a richening in MBS after LTCM's failure, when swaps widened more than MBS Treasury OAS.
- * An accurate COFI model in the 1990s, making projections using Swap spreads.
You can find some of these archived articles on the lower right side of the Commentary page of this website.
1997-2006
This was an extremely interesting period for swap spreads, especially in hindsight. Anyone trying to follow and predict spreads during this period would have been kept extremely busy! I was not tracking macro events at the time, and it is my current interest and research in international money supply flows, since 2007, that has identified some of these relationships.
In a more recent example, during the Crisis, in May 2008, I made some recommendations for different types of MBS based on the hurdle rates of different buyers, at the end of a Crisis Note titled 'What’s LIBOR Got To Do With It'.
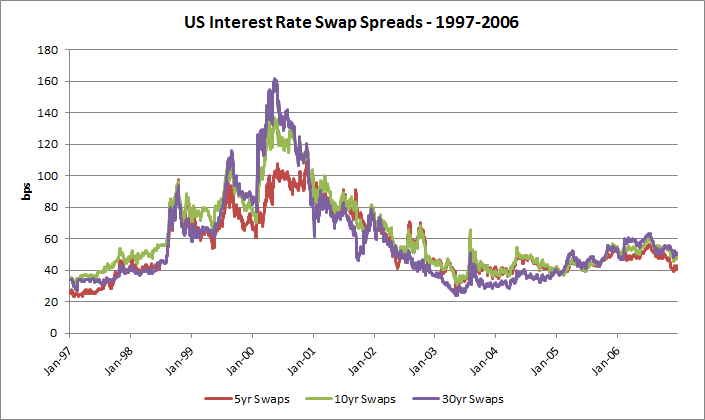
Source: Bloomberg, MBS Mantra, LLC.
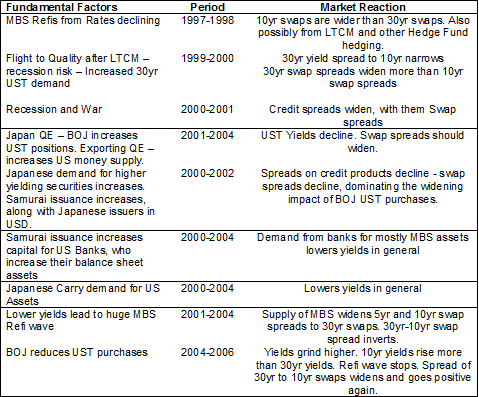
The following table and charts show some of the demand and supply factors that impacted both rates and swap spreads during this period.
UST Yields - 10yr and 30yr
 Dai 2016-02-08 05-07-07.jpg)
Source: Bloomberg, MBS Mantra, LLC.
UST Yield Spread: 30yr - 10yr
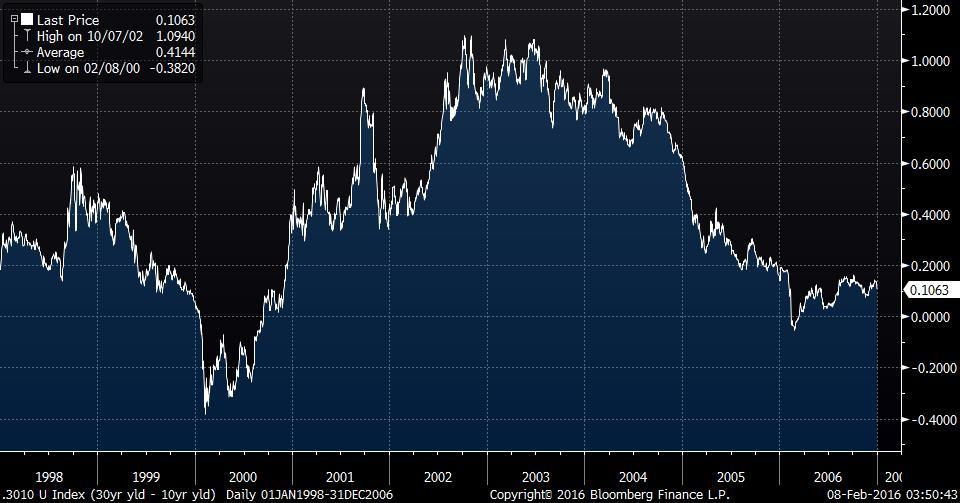
Source: Bloomberg, MBS Mantra, LLC.
Spread between 30yr and 10yr Swap Spreads
 Daily 2016-02-08 04-14-42.jpg)
Source: Bloomberg, MBS Mantra, LLC.
Source: US Treasury, Bank of Japan (BOJ), Bloomberg, MBS Mantra, LLC.
Source: US Treasury, Bank of Japan (BOJ), Bloomberg, MBS Mantra, LLC.
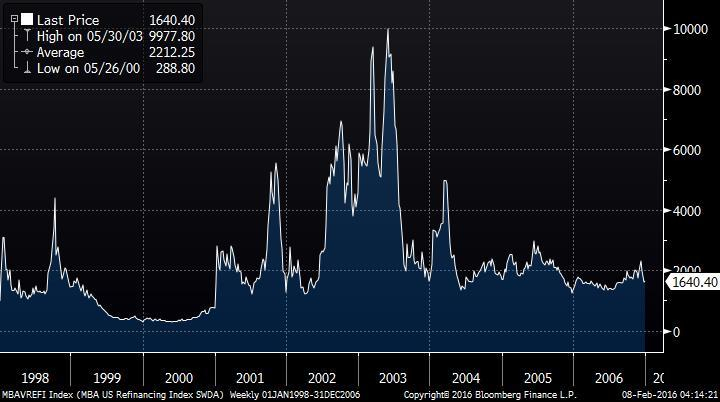
MBA Refi Index
Source: Bloomberg, MBS Mantra, LLC.
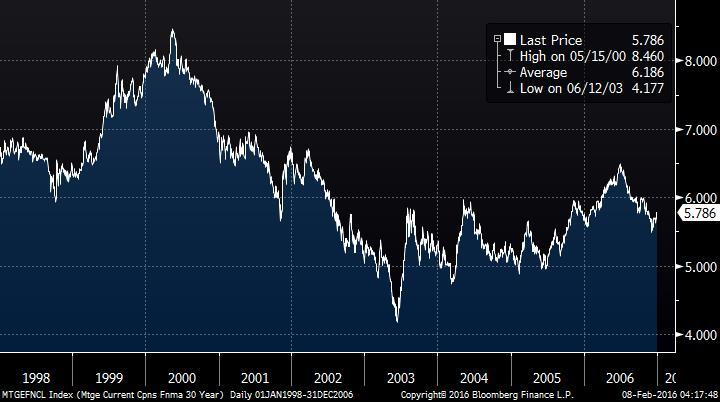
Current Coupon FNMA MBS Index
Source: Bloomberg, MBS Mantra, LLC.
Source: Bloomberg, MBS Mantra, LLC.
In 1998, 10yr swap spreads were wider than 30yr swap spreads. They tightened back in late 1999, only to widen back in 2001, and remained wider than 30yr swap spreads until 2005. There are two primary reasons for this, in my opinion.
In the 1997-1998 period, the widening in 10yr swaps was because of increased MBS Supply, due to refinancing of mortgages from rates declining.
This was again the theme in the 2001-2004 period – MBS supply widened the 10yr swap spread making its spread to the 30yr swap spread go negative.
In between, the internet bubble burst, in 2001, we went into recession, and Mr. Greenspan cut the Fed Funds rate. We were also attacked (9/11), and went to war. These events in all probability led to the widening in credit spreads and the ‘normalization’ of the 10-30yr swap spreads from 2000-2001.
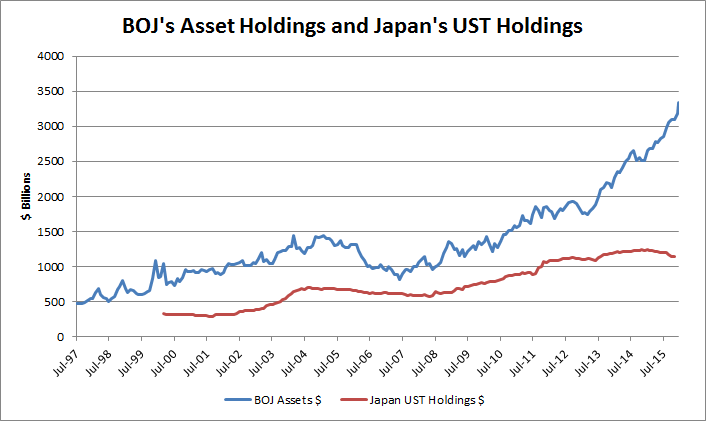
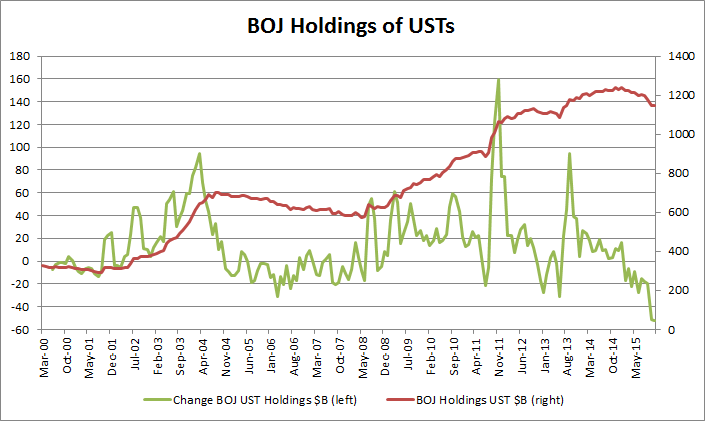
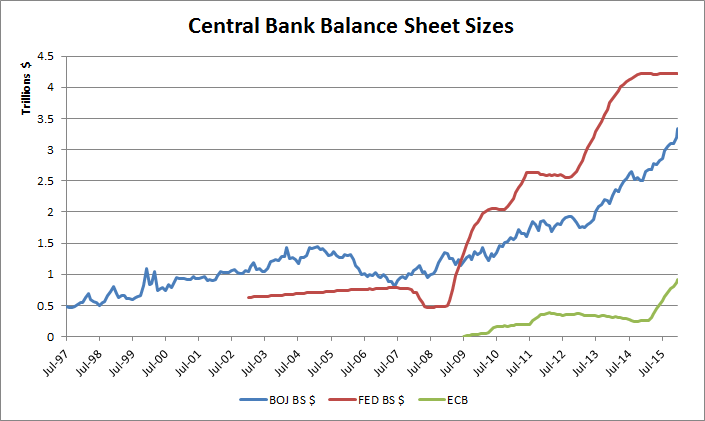
A significant driver for the rally in 10 yr and MBS rates after the intial rally from the Fed's rate cut had stalled in the spring of 2001, and the resulting MBS refi wave that resulted after it resumed, was the Yen Carry Trade, from Samurai and other bonds, as well as direct QE export from the Bank of Japan via its additional purchases of approximately $400B of USTs.
This will be a controversial section of this document for many. It contains a new relationship few have seen before or thought about - the impact of Japan's QE and capital/money-supply export on the US economy, expressed in rates, swap spreads, mortgage refinancings, and in general, recovery from recession. For now, please treat it as my opinion.
As I hope to demonstrate in an upcoming article on the ‘Carry Trade’, by purchasing US bonds, the Japanese retail investor and the BOJ directly injected money into US banks and the US Economy, essentially exporting a form of QE to the US, increasing US Money Supply and helping fuel the US recovery that began in 2003.
I do not think that the coincident spikes in BOJ UST purchases and the MBA Refi index are coincidences!
This was not apparent to many US or certainly MBS market participants, or identified at the time. Japanese demand for yield also existed in other spread assets and was a powerful force, especially when combined with the BOJ’s purchases of USTs.
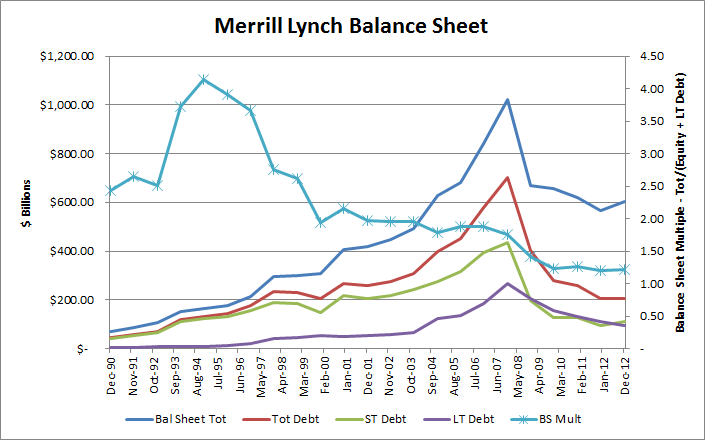
As a result of this Japanese demand, US banks were also issuing samurai bonds. This would have raised their capital, and allowed them to grow their balance sheets. I have written a note on the Samurai bond market that provides many statistics and identifies issuers. I use Merrill Lynch as an example here - the graph of Merrill Lynch’s balance sheet above shows its growth, while the Samurai note show’s Merrill’s reliance of this form of funding.
When the BOJ cut back on QE, and shrank its Balance Sheet size in 2005, US rates rose, refis slowed, and 10yr swaps spreads tightened back relative to 30 year swap spreads.
2006-2016
Source: Bloomberg, MBS Mantra, LLC.
Source: Bloomberg, MBS Mantra, LLC.
Starting in July 2007, the BOJ started increasing its Balance Sheet again, and US yields started declining. Both 5yr and 10yr swaps spreads were widening at the same time, along with all RMBS assets, as the problems in their performance were becoming apparent.
In Sep 2008, after the Lehman bankruptcy, there was a massive global flight to quality into the 30yr UST.
As Harley Bassman points out about the 30yr swap spread in his article, “it first pierced the zero boundary in November 2008 and has remained there ever since.”
Can Swaps be used as a Benchmark anymore?
To be a benchmark, an instrument has to be liquid, broadly accepted, determined by arbitrage or market conditions, should be relevant to other securities, and be able to consistently give you some information, in most cases about relative value.
Market Based Pricing
There is no question that IRS are priced based on markets, and that one can trade them with a click, including on Bloomberg, as long as one has qualified for and signed an ISDA agreement. On this points, I agree with Harley Bassman.
Default Risk of IRS, and Liquidity
Granted, the increase in capital requirements for banks has pushed IRS out of balance sheets and into off-balance sheet entities and exchanges, where the risk of default is lower, collateral requirements might be less, and capital required is less than required for banks. Also you face less risk of onerous ‘marks’ and collateral demand from your counterparties, or even doctored marks that suit your counterparties balance sheet position without reflecting the real risk or market prices. Such behavior was rampant in 2007 in the ABX and CDO markets during the crisis, when indices and swaps indexed to them were trading in a totally unrelated manner compared to the cash bonds. I would agree that IRS are now less risky instruments than they were in the past.
Along those same lines, I should also point out that increased regulation and capital requirements might also have reduced systemic risk by reducing the quantity of one-sided IRS outstanding. By this I mean IRS where the issuing entity took the risk of one side of the swap, and did not lay it off to a counterparty with the opposite financial need. The poster child for such one sided risk taking was AIG, which loved collecting option premiums so much, that it kept creating bespoke IRS and CDS, to the point of having enough synthetic and derivative exposure to bring the world economy to its knees. But, I suspect every large bank was also doing so in IRS.
The traditional descriptions of IRS in finance textbooks or dealer product notes used to show one side being a hedger and the other side being a speculator. With reduced capital available to banks and derivative subsidiaries, IRS liquidity might now be lower than it was pre-crisis, since banks cannot speculate.
When thinking about IRS, one should also consider this: the US and Global bond markets have ballooned since the 1990s, with approximately $40T in bonds issued by US borrowers. This debt has not shrunk in any significant manner in the past few years. On the other hand, the balance sheet of dealers and banks that are counterparties to IRS has shrunk. Bond liquidity is certainly lower than it has been, and quite possibly the ratio of IRS to outstanding bonds is not sufficient to provide a liquid benchmark, whereas in the past (such as pre-2005 periods), with a smaller outstanding balance of total bonds, even a smaller quantity of IRS outstanding might have been sufficient to be considered liquid. Also, there are a lot fewer dealers supporting liquidity today.
According to ISDA, the notional outstanding IRS is approximately $500 trillion. But the daily traded volume is only about $20B-$30B according to their graphs.
Here are live swap volumes that are reported by Bloomberg. (“SDR RATE” page). The average daily trading volume appears to be higher than that reported by ISDA – the 5yr Swap alone seems to be $25B. As you can see, it is the 5yr IRS that is the most active.
Source: Bloomberg, MBS Mantra, LLC.
In contrast, FINRA’s daily TRACE data shows that $272B in MBS TBA trades occurred on 2/08/2016. (While there likely is some double counting due to dollar rolls, it is still sizable). Maybe MBS TBA might be a better benchmark for Fixed Income!
Negative IRS Spreads
The arguments put forth for why swaps are trading at such tight (negative levels) are interesting. There are many aspects to this unusual phenomenon that should be discussed.
Referring back to the first table above, tight or negative IRS and TED spreads should mean one or both of two things – too much supply of UST, raising their yields, or too much net demand for LIBOR (and by extension Non-UST bonds), tightening spreads, which could also includes a shrinkage in the outstanding size of credit bonds.
We know that the outstanding balances of corporate credit bonds has not shrunk, although Non Agency RMBS certainly has. So, RMBS shrinkage is one possible reason for the reduction in non-UST bonds. Many Fixed Rate RMBS bonds created in the 2005-2007 period had interest rate swaps embedded in the deals to create LIBOR floaters to meet bank and LIBOR fund demand - the reduction in RMBS origination and the resulting elimination the corresponding supply of Pay-Fixed swaps might also lead to swap spreads tightening.
The other possible reason is that we have too many USTs, and that their yields are too high. This, I believe, is plausible. This graph shows US Treasury Total Public Debt Outstanding - $18.996 Trillion, up from $8.68 Trillion on 12/31/2006. (PUBLDEBT Index on Bloomberg).
US Treasury Total Public Debt Outstanding
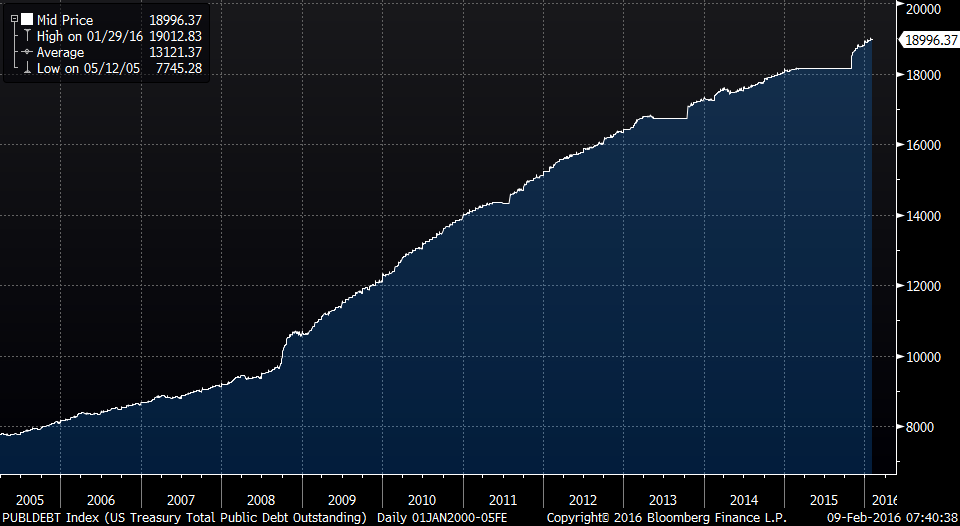
Source: Bloomberg, MBS Mantra, LLC.
So how much is US debt cheap by due to this increased supply? If LIBOR is correctly priced, with reduced or no counterparty risk, IRS spreads of all terms should be Zero. Well, in that case, USTs are cheap by exactly the amount that the Swap Spread is negative!
And this might be plausible, given that the sovereign country debt of most other large countries (that have savings) are trading at close to zero yields. In which case IRS might be still a good benchmark, giving us valuable information!
Could the negative swap rates then simply be the elimination of Convexity Bias in IRS?
Please google the term, but here are 2 links on the topic:
There were multiple topics in news stories on Bloomberg that allow one to understand why the 10yr and 5yr swap spreads recently went negative. This first one has to do with US Treasury selling by Japan and China. This should have caused swaps spreads to tighten, as they did in October. Identification of the bonds they sold should shed some light on this.
Much of this UST supply was apparently still piled up on dealer balance sheets in January. With the Fed threatening higher interest rates, and multiple investors expecting higher rates too, this was not surprising.
In my mind, the 30yr swap rate at -42 bps, is a completely useless quote, as its levels, spreads, and spread movements are so far removed from those of any other long securities (which are primarily corporates). It cannot serve as a benchmark, except maybe for the 30yr UST itself. The highest 3 rated corporate names are Exxon, AAA rated, JNJ, also AAA rated, and Microsoft, now AA+. Their bonds all trade significantly wider and are all positive spreads to Treasuries. What investor would want to receive fixed at a negative spread to Treasuries when actual bonds are available at positive spreads? (Well, maybe banks due to changes in their required capital, but they usually do not buy 30yr bonds.) In a highly liquid market, it is unlikely that the spread would have gone negative. The 30yr IRS is merely a curiosity.
What about the concept of IRS being “Risk-free”? Or, at least, less risky than Treasuries?
The concept of a ‘risk-free’ rate is very theoretical, and usually used in arbitrage pricing models, most commonly in options theory, where it forms part of the no-arbitrage concept of put-call parity. But even in that context it is not very meaningful, as one of the underlying assumptions in put-call parity is identical volatility inputs for puts and calls. When put and call volatility is different, as they often are (run OHT on any security), the sensitivity of the option price to the ‘risk-free’ rate gets dominated by the volatility input or the implied volatility.
The primary risk from USTs comes from their prices, which were set by demand and supply. Maybe in a gold-standard or fixed money regime short term debt they might have been considered risk-free as there was no ability to increase money supply, and thus no need to tamper with the benchmark rate for money.
With Central banks being able to create forms of money at will, with quantities adjusted through open-market operations and repo, the supply of money can be reduced or increased, changing its price. So no form of fiat money can be considered risk-free. By extension, neither can even a short term form of government debt, since central banks can and do change policy rates impacting prices of all their debt including short term debt. This assumption from finance is one for the history books!
The same is true for swaps - they can be created at will – there is no fixed supply. Supply will change spreads and prices.
In real life there is no risk-free rate.
Is the IRS a Benchmark for Fixed Income?
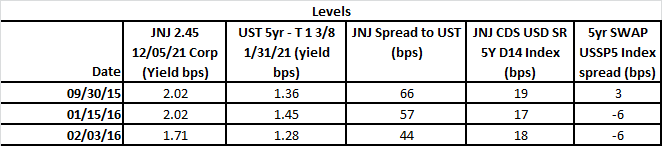
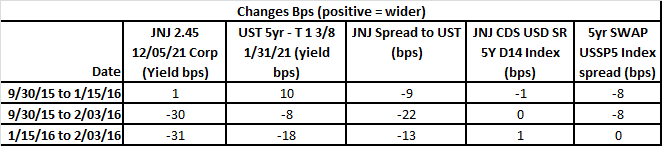
If one wants to argue that IRS is the underlying benchmark, and that corporate bonds have widened due to increased credit risk, one way to test that theory is to use single name CDS and layer it on top of swaps, and compare it to changes in a cash bond’s yield and spread in the same name.
I am not a corporate bond specialist – I randomly picked a AAA name, chose a 5yr bond, based on 5yr swaps being the most liquid, and looked up the data below. Maybe the analysis below is not representative of the market, and maybe there was news on the specific issuer that influenced the analysis. However, if the data is unbiased, it does not make a good case for IRS as a benchmark for non-UST bonds.
These tables compare JNJs 5yr bond to CDS, IRS and UST.
Source: Bloomberg, MBS Mantra, LLC.
Source: Bloomberg, MBS Mantra, LLC.
JNJ’s 5yr, being a AAA security, seems to have benefited recently from a flight to quality, rallying more than the 5yr UST, and tightening. JNJ’s 5yr CDS, reflecting its credit risk, has remained essentially unchanged, and its yield on Jan 15, 2016 is essentially unchanged from September 30, 2015, whereas its spread to USTs has changed as the UST rallied, tightening more than amount that the UST has rallied.
The 5yr UST did go UP in yield between 9/30/15 to 1/15/16, in response to the Central Bank Selling. This tightened the 5yr Swap spread, explaining its movement to negative spreads.
If the IRS were a true risk-free benchmark, I think that it should have attracted more demand than the UST in the recent flight to quality, and tightened in a similar manner to the JNJ 5yr corporate bond. Instead, it was essentially unchanged. (The counter argument to this is the lack of depth and limited size of the JNJ bond.)
Comments on other issues that readers have raised
- The shape of the yield curve can influence swap spreads
If you are using swaps as a hedge or a benchmark to match the cashflows of an asset or liability, if the payments are matched, then any yield curve impact will apply to both and spreads should move in tandem, notwithstanding any minor difference from coupons being different. Any mismatch between cashflows can be impacted by steepening or flattening, but I could consider that to be a delibrate decision by the investment manager, such as hedging or funding MBS with fixed rate semi annual non amortizing swaps.
- Funding costs of USTs can influence swap spreads
Certainly, funding costs will impact your hurdle rates. and the net difference in funding costs must be compared to the net asset spread - swap spread (hedged spread) that an investor might receive. But since funding costs are different for different investors, this will determine who invests and who does not - i.e. determining the marginal participant.
The funding costs for USTs might go on special if there is a shortage for a specific CUSIP. This will result in greater demand for that bond, if there is an abnormally wide spread to be had using leverage, lowering its yield. This should WIDEN swap spreads.
- Negative swap spreads are caused by banks having a capital charge for USTs and none for swaps
I am researching this and will comment on it more. However, at first blush, I think that this is a rationalization to a reporter by a trader or analyst that has not looked beyond his desk at the big picture - demand and supply of USTs.
We know banks are sitting on mountains of cash. I am being told that they are using swaps to extend duration as it is more capital efficient to use off-balance sheet instruments instead investing in USTs. Excessive demand for Receive-Fixed would certainly tighten swap spreads.
Maybe that is so, and maybe swap spreads did tighten in response. However, banks are not known for investing in long bonds. It is the 30yr swap spread that went negative first, in October 2008, not 2yr, 5yr, or 10yr swap spreads that are more natural for a bank seeking to match liabilities.
The 10yr swap spread only went negative and stayed negative recently, in Sep 2015; the 5yr swap spread in October 2015, and the 2yr is still positive. To me, the negative swap spreads do not "smell" of banks going long synthetic fixed rate bonds. The initial tightening in 2008 was plausibly due to banks demand from regulatory changes. The current further tightening to negative swap spreads is highly unlikely to have been caused by bank demand, although if bank rules do change or are reversed, they would likely widen by the amount of the tightening in 2008.
If this is the case - ie. the banks are cornering the swaps market due to regulatory and non-market driven reasons - then banks are distorting swap spreads, and reducing the abiliity and volatility of swaps to respond to market conditions of other asset classes via hedging or arbitrage mechanisms. All the more reason to leave this market to the banks as there is no way that other investors can compete with TBTF institutions that do not have to respond to margin calls. It will not be a market-driven marketplace.
This is borne out by my little analysis on JNJ bonds above.
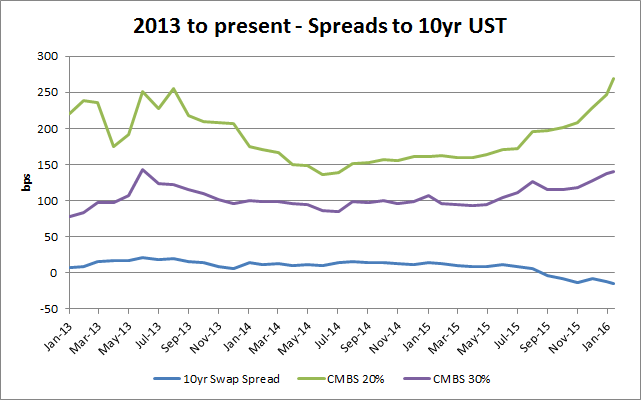
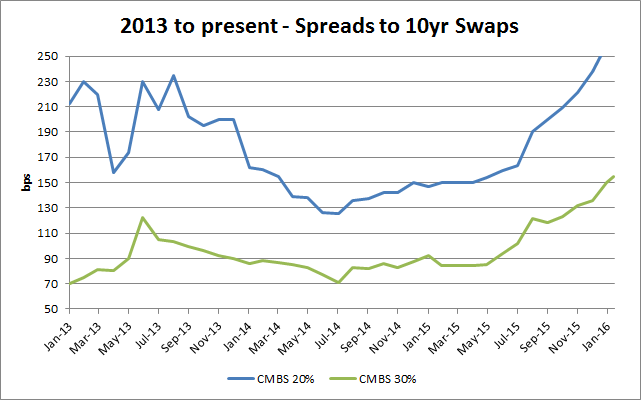
2/12/2015 - CMBS 10yr Analysis
Some readers have asked for more examples and proof, as they do not accept that their benchmarks are not good anymore.
It seems people are blindly doing what they are used to, without analyzing the performance of their benchmarks, and effectiveness of their hedges.
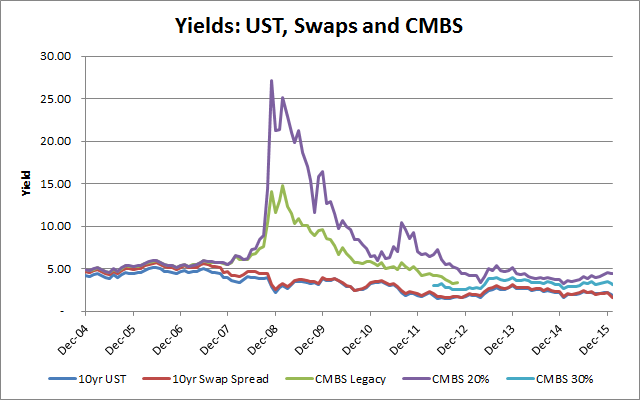
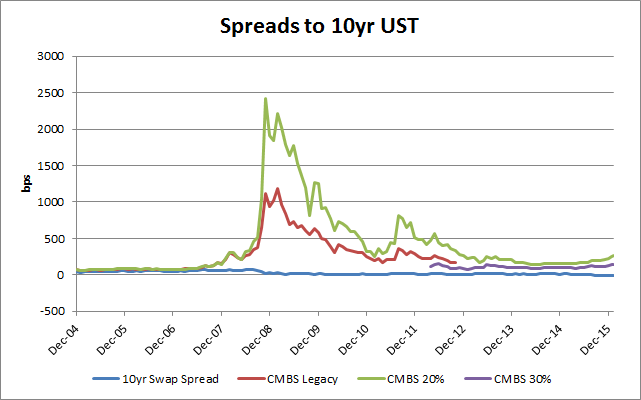
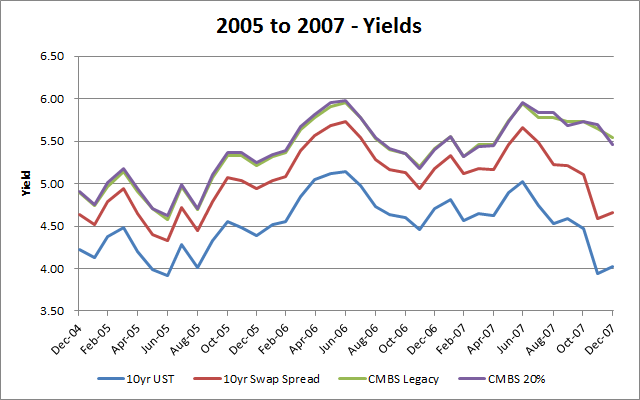
I chose to analyze 10yr CMBS. The CMBS Market is definitely using Swaps as its benchmark - current Bloomberg indices do not even compute spreads to USTs for CMBS anymore.
Anyone can perform this analysis and they should, to safisfy themselves about the effectiveness of their Swaps benchmarks. The Bloomberg Indices I used are: GT10 Govt, $$SWAP10 Index, CMBGASST Index, CMBG2ASS Index, and CMBGASW2 Index.
Source: Bloomberg, MBS Mantra, LLC
Source: Bloomberg, MBS Mantra, LLC
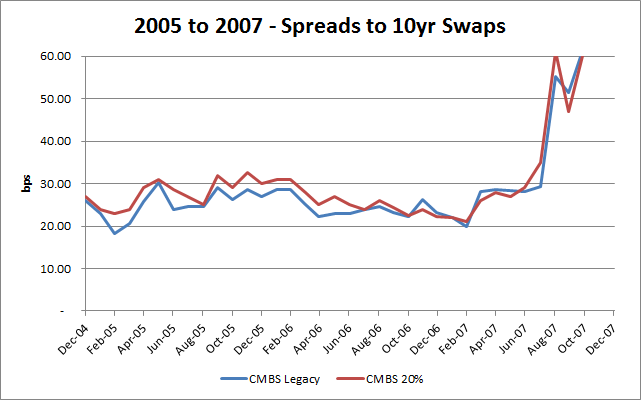
Swaps did not work as a Benchmark during the Crisis.
Source: Bloomberg, MBS Mantra, LLC
Source: Bloomberg, MBS Mantra, LLC
Source: Bloomberg, MBS Mantra, LLC
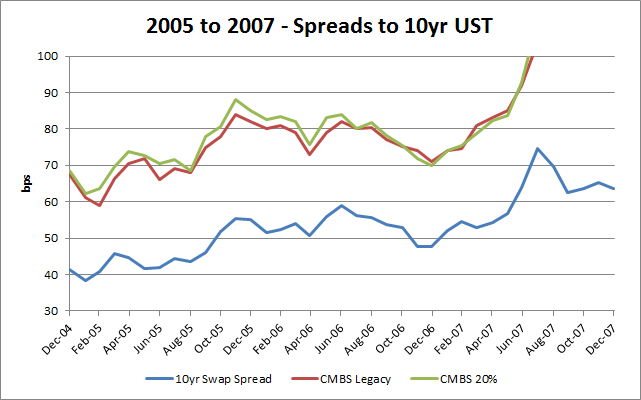
Clearly, in the pre-2007 period, 10yr Swaps did a remarkable job as a Benchmark and a Hedge for 10yr CMBS, performing within a risk range of approximately 10bps. Using 10yr USTs as a hedge would have been riskier - the range was almost 30bps.
Source: Bloomberg, MBS Mantra, LLC
Source: Bloomberg, MBS Mantra, LLC
Source: Bloomberg, MBS Mantra, LLC
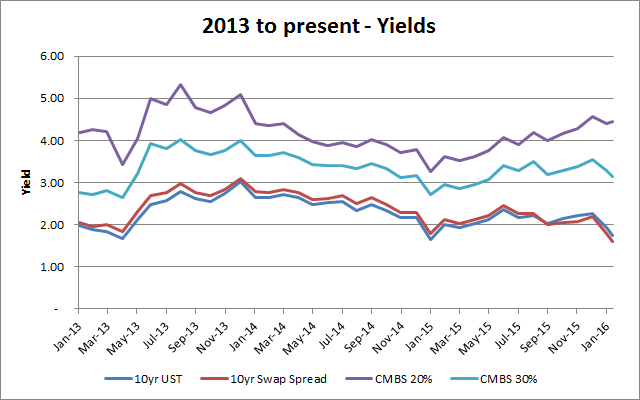
Post 2013, 10yr Swaps make a terrible hedge for 10yr CMBS (30% CE), with a risk range of approximately 80bps. This is especially true after September 2013, when 10yr Swaps spreads went negative. Spreads to USTs actually look more stable. Swaps are no longer suitable as a Benchmark or Hedge.
Post 2013, 10yr Swaps make a terrible hedge for 10yr CMBS (30% CE), with a risk range of approximately 80bps. This is especially true after September 2013, when 10yr Swaps spreads went negative. Spreads to USTs actually look more stable. Swaps are no longer suitable as a Benchmark or Hedge.
My conclusions:
The two examples above, of JNJ 5yrs and CMBS 10yrs demonstrate the reduced effectiveness of using IRS as hedges and thus as benchmarks.
Negative Feedback Loop
Could this lack of tracking be causing a negative feedback loop by investors that are hedged or benchmarked with swaps? If, for example, an investor sees that his CMBS 10yr is widening to swaps, he might sell it, increasing supply of CMBS into the marketplace, leading to further widening to swaps.
If so, the usage of swaps could be adding to global volatility, and it is important to address this issue and change benchmarks before the market enters a full blown sell-cycle
Change in Marginal Buyer of USTs
The Fed started purchasing USTs for its balance sheet during QE1 and QE2. It has been the marginal buyer of USTs, and subsequently MBS, since. The Fed signals its purchases in the minutes of FOMC meetings, allowing dealers to accumulate positions to front-run it. USTs have stopped being priced by the market, and to me, their yields are artificial, and possibly too high compared to other sovereigns, unless the market believes that the US has the same risk as Italy!
Other central banks are owners of and have been purchasers of US Treasury bonds too, but not to the same extent that the Fed has of late. One can have a discussion about why the Central Banks of other countries continue to own USTs, and keep supplying their QE to the US, but that is a different conversation.
Since the Fed can create money, does not hedge, and has no cost of funds, swap spreads cannot fulfill their traditional role as an arbitrage driven benchmark of the cost of funds of the marginal buyer.
The predictive capability of IRS as a benchmark for much beyond QE related flows is now limited. It is when QE is unwound that Swap Spreads in general will become a useful benchmark again.
For now, IRS have become an mere instrument that banks trade, that might allow a speculator to bet on QE. Desks that used swaps to hedge their positions or new issue pipelines now expose themselves to risk from the QE activity of central banks.
I would not use IRS as a benchmark any more.
“No one appears to consider that inverted spreads could possibly be a normal feature of market environments going forward.”
Swap spreads could go more negative if the Fed or other central banks decide to unwind or reduce their Balance sheets. I do not expect the Fed to do that, however, Japan might. The research I am currently conducting suggests to me that the only effective tool that central banks have to manage money supply remains direct injection of cash into the banking system through QE.
My research also indicates that interest rate policy has not worked in a long time, that it is unlikely to work in the future, and that it is counterproductive. When central bankers say that negative interest rates have worked better than expected, they are saying that they expected them to have negative outcomes, and that by having no effect, which is what I believe is happening, the outcome is better than they expected. This is not a particularly strong reason to use negative rates, but I think that their stance is that there is nothing to lose.
For these reasons, I am expecting more QE, although negative interest rates in the US would not surprise me, as I do not think that the Fed has a handle on the effectiveness (or lack of) its interest rate policy mangement. I doubt that the QE will come tomorrow. Will it come before 2020? Likely. Whether swap spreads will widen or tighten will depend on if the QE involves buying more USTs (IRS widens), or if the Fed decides to buy Corporates or even ETFs, stocks or other assets (IRS tightens).
What can one use as a benchmark?
I think the world of a single benchmark curve for Fixed Income is ending. Swaps used to be the benchmark for many years until 2007, but they are no longer useful as a benchmark. We are headed into a period of absolute return benchmarking for different types of duration and assets.
There is no perfect alternative that I have identified (as yet) that one can use automatically or without thinking too much (ie compare yields or subtract spreads) - in the same manner that you used to be able to do with swaps. All alternatives I have thought of have downsides related to liquidity, downgrades of components, lack of a key rate duration curve, etc. But no index is perfect as a benchmark - even the large cap Dow Jones and S&P equity indices have companies entering, exitiing, or failing (Enron, for example). Maybe an index company can formulate a series of indices with different durations based on actual trades and time stamps of TRACE reported bonds identified as liquid. This could then be used to create a set of indices that the derivative market could trade instead of swaps.
In the meantime, each sector needs to be evaluated individually, with the hurdle rate of the marginal buyer for that sector identified. This can then allow an investor to decide if that hurdle rate is sufficient for him to participate in that sector.
Some investors will be levered and have access to leverage, and they will drive down the yields of assets that can be levered (this is already happening, for example Single Family Rental securities and RMBS 2.0). The unlevered yields of those assets will not be sufficient for most investors. In a low yielding world, the temptation to use leverage will be very high. Unlevered investors should not compete with them for these low yielding assets, but focus on securities that cannot be levered easily, that might allow them to achieve higher absolute returns.
The usage of leverage will however need to be monitored for potentially timing investments (instead of, for example, quaintly using wide swap spreads as an indicator of relative value), and for monitoring risks, as an unwind of leverage can be catastrophic, as was discovered in 2007. Effort should be invested in identifying the marginal buyer and their hurdle rates.
Harley Bassman states that “finance has now become a business without borders, and as such, an internationally accepted rate structure may make more sense for a global economy than a rather parochial single-country issuer.” He also asks “whether we have found a new sea level for interest rates.”
I agree with the statement that an international rate structure makes sense and in my past Crisis Notes, I have argued for such a structure. However, our central banks seem to have accomplished this with coordinated policy, mostly benefitting the US through foreign central banks purchasing of our Treasury debt, and thus allowing us to benefit (if one considers asset inflation a benefit) from foreign QE.
We are at sea-level, with rates, globally, real, and nominal, at close to zero. Is Zero the new Benchmark?
Samir Shah
Founder, President and CIO
MBS Mantra, LLC
2/9/2016
Founder, President and CIO
MBS Mantra, LLC
2/9/2016
© 2016, Samir Shah
© 2016, Samir Shah