Carry Trades, The Pricing of Assets, and The Failure of Macro Economics: 

1/28/2016
Source: MBS Mantra, LLC, Bloomberg, Federal Reserve Bank, Bank of Japan

I have been formulating this analysis of Carry Trades and Assets since 2006, when I first researched Carry Trades to understand the Icelandic economy.  The magnitude of the Carry Trade emphasises its impact on markets and its importance to Macro Economics, which heretofore has not been appreciated. 

Many parts of this discussion are derived from my prior Crisis Notes (see the Archives) - I discuss the Carry Trade in almost every Crisis Note. The analytical framework that I have used since 1988 - that Hedging and Funding Costs determine Asset Valuation - has led me to research the supply of capital - primarily from Japan - and the resulting impact on the prices of assets that are described herein.

In this Note I am consolidating and augmenting my thoughts, and am attempting a comprehensive, and hopefully definitive, analysis of Carry Trades: how and why they are the primary determinant of Asset Prices, Money Supply and Asset Inflation, squeezing out the real economy in the process, and rendering Monetary Policy impotent.


The Shah Carry Indicator ("SCI")

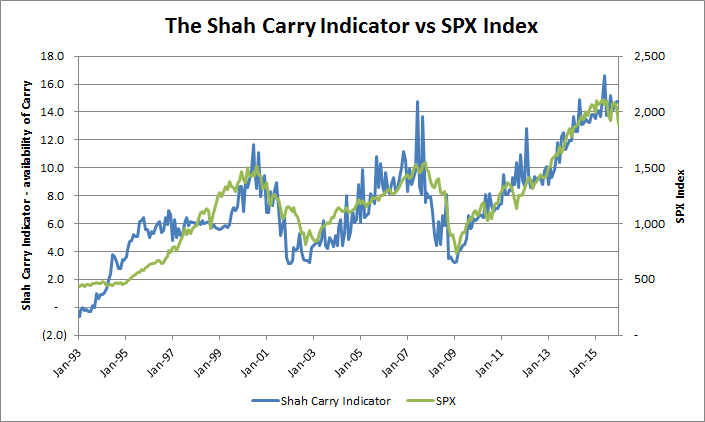
I have created an indicator that quantifies the availability of Carry available to the US economy, based on the various components of the Carry Trade that I identify below. The graph above compares it to the S&P Index. As you can see above, the correlation is quite remarkable.  The components chosen are based on my personal knowledge, from observation of markets and of flows of capital, and the overall indicator is a linear combination of weighted carry sources. 

The discussion that follows identifies the various components that determine Carry, and thus Asset Prices, in the US. This is a very general framework that can be applied to any economy that is the recipient of Carry capital flows from a Funding Country or countries.  I have been making the argument for many years that the US is the world's largest recipient of Carry Funding, primarily from Japan, and that the Global Financial Crisis was primarily a Carry Deleveraging event.  

In addition to Japan's almost permanent Carry Funding, the Fed periodically provides Carry Funding that is deployed both in the US and in Emerging Markets.

It is Aggregate Carry that determines Asset Prices, not Economic Stimulus from any single provider of Carry.

There are 3 major sections:

  1.  Carry Trades - describes the various sources of Carry at different points in time
  2.  Carry Trades and Assets - graphs showing the responsiveness of various assets to the Carry Trade
  3.  Macro Economics - the impact of the Carry Trade on Money Supply and the Transmission of Policy

Section 1:  Carry Trades
“Carry Trade” is the term given to borrowing money in a low yielding currency (i.e. country), and investing the proceeds in the currency and assets of a higher yielding country, thereby  earning a net spread, or carry.

Carry trades should never exist, as the economic concept of “Interest Rate Parity” should prevent any arbitrages from occurring.  However, they do exist and are the most powerful force in Finance and Economics, as they thwart attempts by Central Banks to conduct monetary policy.  The world as we know it today has been sculpted by Carry Trades, and almost all asset prices are a result of asset inflation (and deflation) from deployment (and withdrawal) of Carry Leverage.  

I do not understand why Economists have not modifed their theories and macro economic policies to incorporate Carry Trades. My assumption is that, since carry trades should not exist due to no-arbitrage assumptions, economists think that they can be ignored, and thus continue to use their single-economy Keynesian models to manage policy. This is surprising, given the number of practicing economists that join or start Macro hedge funds that implement the carry trade.

In one of my incomplete 2009 Crisis Notes, I start to rewrite Macro Economics, and identified it as  'The Shah Theorem' (although it should be called a Hypothesis for now) that creates the Carry Trade:

When One Economy Enters a Liquidity Trap, All Monetary Policy Fails Globally

The primary result of Central Bank Keynesian stimulus policies, as executed by Carry Trades, is to export capital, preventing desired monetary expansion and desired inflation in the funding country, and instead creating excessive money supply and asset Inflation in capital-receipient countries, effectively exporting inflation. ( I proposed a solution to this in one of my old Crisis Notes, but since it is unlikely to happen, I'll save re-discussing it for later.)

In crime solving, they say, “Follow the Money”. This also applies to understanding financial markets. Without an understanding of the Carry Trade, investors cannot have an understanding of financial markets and risks, and functions such as Risk Management cannot be performed.  


The Yen and Dollar Carry Trades

The original modern Carry Trade was the Yen Carry trade, deployed to great effect in 1994 by Julian Robertson of Tiger Management. It is quite likely that George Soros of Quantum, and LTCM, in addition to other hedge funds as well as Wall Street prop desks, were also using this strategy – many lost money at the same time – but there is very little information available publicly about their specific activities.

This trade is considered to be the most profitable trade in the history of hedge funds - borrowing money in Yen at very low interest rates, and investing it in other countries, initially and sizable in the US, but soon in  many other market as well, such as Russian, Thailand, New Zealand, Australia, Iceland, etc.

The Yen Carry trade has not stopped funding the world’s productivity (or excesses) since then.  In addition, we have also enjoyed periodic episodes of Dollar Carry Trade, and more recently to a minor extent, Euro Carry Trade, as both the Fed and ECB have effectively cut rates to zero.  There are other countries with zero or negative interest rates, but their capital exports are not very scalable, so I won’t discuss them at this time.

All three major central banks have also embarked on Quantitative Easing to further increase money supply, in response to entering Liquidity Traps, providing more fuel for carry trades.

Due to the high leverage involved in Carry Trades, periodic periods of nervousness have led to the withdrawal of Carry Financing, leading to massive selloffs in Global markets:  Leveraged Asset Growth comes hand in hand with Leveraged Downside.

Most periods of apparent de-correlation between Yen and various assets can be explained by augmentation by the periodic US Carry Trade, as well as Samurai Bond supply, which can dominate at the margin. 

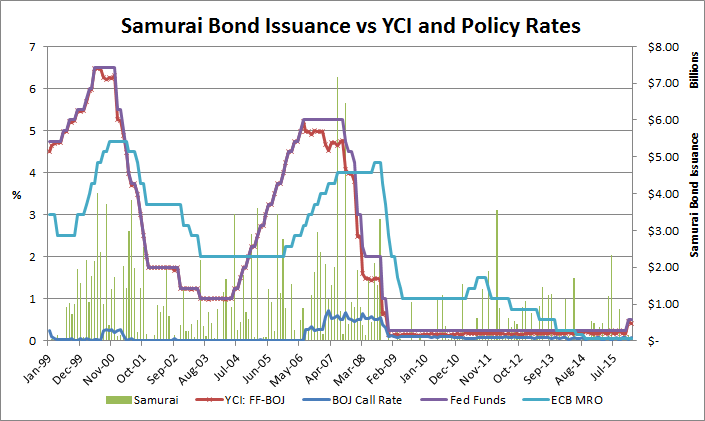
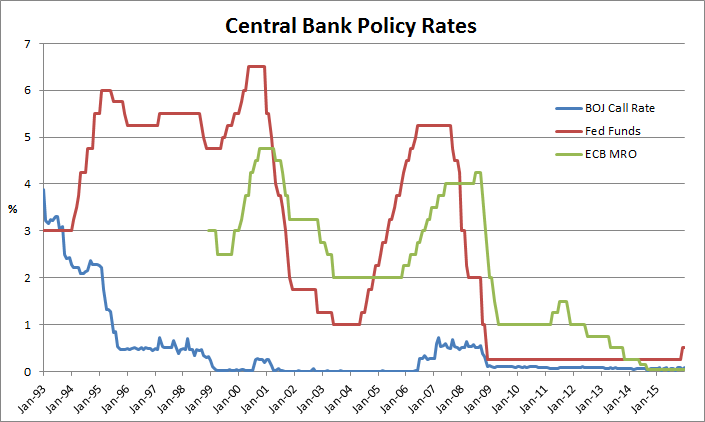
The following chart shows the policy rates of the Bank of Japan (Unsecured Overnight Call Rate), The Federal Reserve Bank (Fed Funds Rate), and the European Central Bank (MRO – Main Refinancing Operations Rate). 

Source: Bloomberg, MBS Mantra, LLC
1993-1998: The Yen Carry Trade

This was the period that made the Yen Carry Trade both famous and infamous.

The history of the Yen Carry Trade begins in the late 1980s, when, due to unconstrained money creation, Japanese asset prices appreciated greatly, and were part of a “bubble” economy .  Subsequent deregulation of the banking system globally, and Samurai bond issuance rules in Japan (which I discuss in the Samurai bond Crisis Note) also played pivotal roles.  

In 1989, The BOJ tightened monetary policy and raised its policy rate, continuing into 1990. In 1990, the bubble burst, and the Nikkei went from 38,915 to a low of 20,221 in 9 months. In 1991 and 1992, asset prices collapsed, resulting in large qualities of Non-Performing Loans (“NPLs”) at Japanese Banks.


In a textbook Keynesian response to a financial crisis, the BOJ started cutting rates again, to allow banks to earn their way out of the crisis, and resulting in the creation of many ‘zombie banks’.  

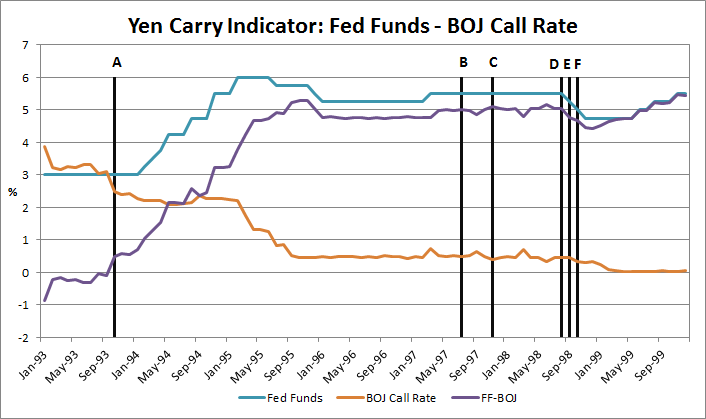
Japan’s policy rate crossed the US policy rate at 3% in October 1993, setting the stage for the Yen Carry Trade.

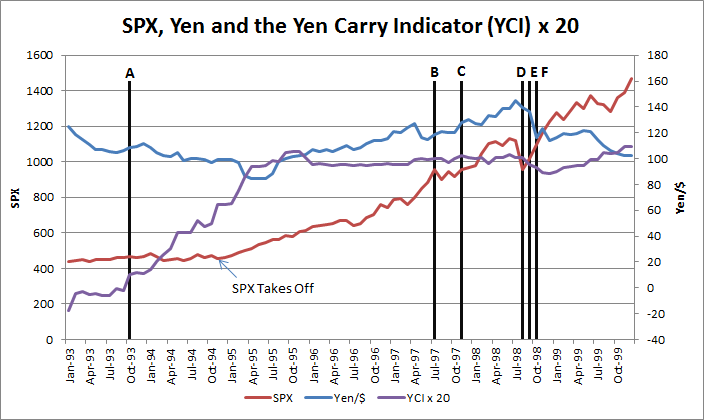
When, in March 1994, the US began to RAISE rates, following a recovery from the 1991 recession, the Yen Carry trade started in earnest. This resulted in a weakening of the Yen, a jump in Samurai bond issuance, and a change in trajectory of the S&P Index in November 1994 (a “hockey stick”), starting a rally in US markets that continues to today, with interruptions in 2000 and 2007.

I thus define a new Indicator: The Yen Carry Indicator ("YCI"), which is the Fed Fund Rate minus the BOJ Call Rate.  This is good enough to explain the US stock market and Economy in the 1990s. I modify this to create the Shah Carry Indicator ("SCI") in order to generalize it and apply it to other time periods and economies.

A number of important trigger events occured in this period, that are represented on the charts that follow as vertical lines with the following legends:

A: October 1993 - Yen Policy Rate Crosses US Policy Rate, signalling the availability of Carry Trades
B: July 1997 - Asian Crisis starts, with the failure of Thai markets
C: November 1997 - LTCM Peaks and begins failing
D: August 1998 - Russian Crisis Starts
E: September 1998 - 9/23 - LTCM is bailed out; 9/28 - Fed Funds are Cut
F: October 1998 - 10/7 to 10/8 - Tiger Management loses $2BB in one day; $5BB since 9/28
Source: Bloomberg, MBS Mantra, LLC

Initial Funding of the Yen Carry Trade was through Samurai Bonds
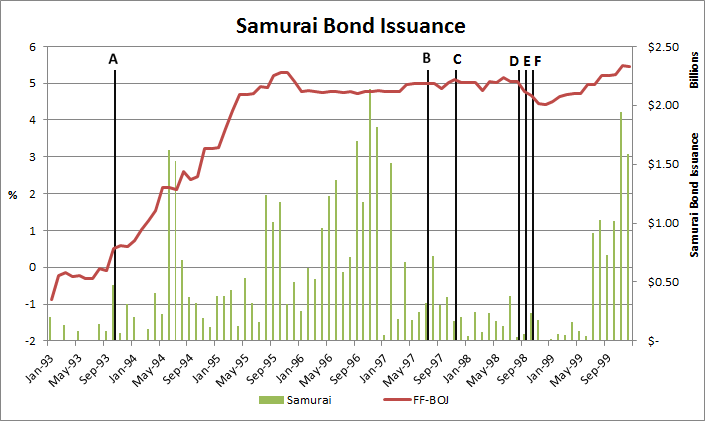
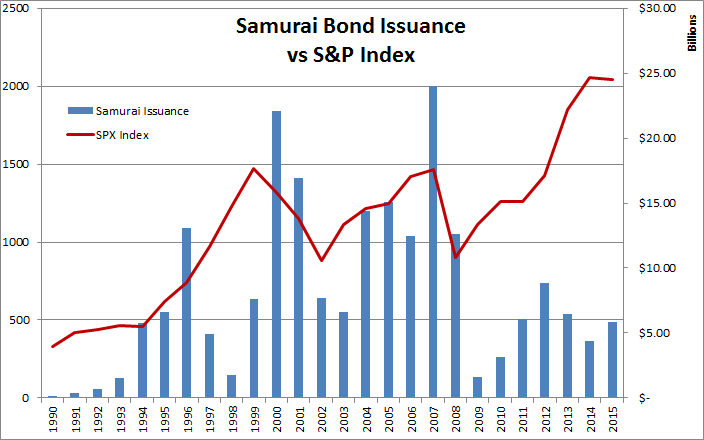
Prior to October 1993, Samurai issuance was sporadic. However, starting in October 1993, Samurai issuance increased dramatically, with $471mm being issued in that month. From January 1994 to January 2002, there was no month without Samurai issuance, with many months with greater than $1.5bb being issued. Supply in this first wave from 1994 to 1997 peaked in 1996, as word of this strategy spread to more participants, I presume. Issuance slowed as the Asian financial crisis was triggered in 1997. When the Fed cut rates in late 1998, after LTCM and the Russian Crisis (D), Samurai issuance slowed drastically. Large scale Samurai issuance resumed in 1999 after the Fed raised rates, while the BOJ cut rates once more to 0.1% , and also embarked on Quantitative Easing (“QE”), which I describe below.
Source: Bloomberg, MBS Mantra, LLC

I recently finished a Note about the Samurai Bond Market, which gives extensive details about this market. I was alerted to the Samurai bond market when Lehman failed, and I read that 40+% of Lehman's debt was Samurai (I don't remember the source).

Between 1994 and 2000, $39bb of Samurai bonds were issued.  Since the majority of the issuers were US financials, many of their bond liabilities could count as capital, allowing these issues to greatly increase bank balance sheets, flowing through into US money supply, through margin and commercial lending.

In addition, a Hedge Fund’s prime broker could easily borrow in Yen from Japanese banks or Japanese branches of US Banks, as Japanese money supply had expanded while Japanese C&I lending had not, resulting in excess non-earning deposits. (Japanese banks in the 1990s would go as far as depositing their deposits at other Japanese banks to earn a return, in addition to continuing to make loans that had no hope of repayment.) I have not yet figured out how to identify and measure the size of this more direct Yen Carry funding.


The Role of Tiger Management (and other "Macro" Funds)

It had been known that Julian Robertson of Tiger was using the Yen Carry trade, and was the largest Macro Hedge Fund at the time, and that he was placing leveraged bets, but until Tiger blew up in the wake of the Russian and LTCM crises, the magnitude of the importance of the Yen Carry Trade, and Tiger, has never been quantified.

Quoting from the Paul Krugman link earlier in this post, 
...Tiger Management, until recently the largest such fund in the world. In its heyday in the summer of 1998, Tiger had more than $20 billion under management, considerably more than George Soros' Quantum Fund, and was reputed to be even more aggressive than Quantum in making plays against troubled economies. Notably, Tiger was perhaps the biggest player in the yen "carry trade"--borrowing yen and investing the proceeds in dollars--and its short position in the yen put it in a position to benefit from troubles throughout Asia. But when the yen abruptly strengthened in the last few months of 1998, Tiger lost heavily--more than $2 billion on one day in October--and investors began pulling out. The losses continued in 1999--from January to the end of September Tiger lost 23 percent, compared with a gain of 5 percent for the average S&P 500 stock. By the end of September, between losses and withdrawals, Tiger was down to a mere $8 billion under management.
From the link above we know the following:

- Tiger lost $5.5B between September and October 1998
- Tiger lost $2.1B in September 1998
- Tiger lost $3.4B in October 1998
- Tiger lost $2BB in one single day in October
- Tiger had 5.5:1 leverage

I use this information to understand the importance of Tiger to the US stock market. Here is what happened:

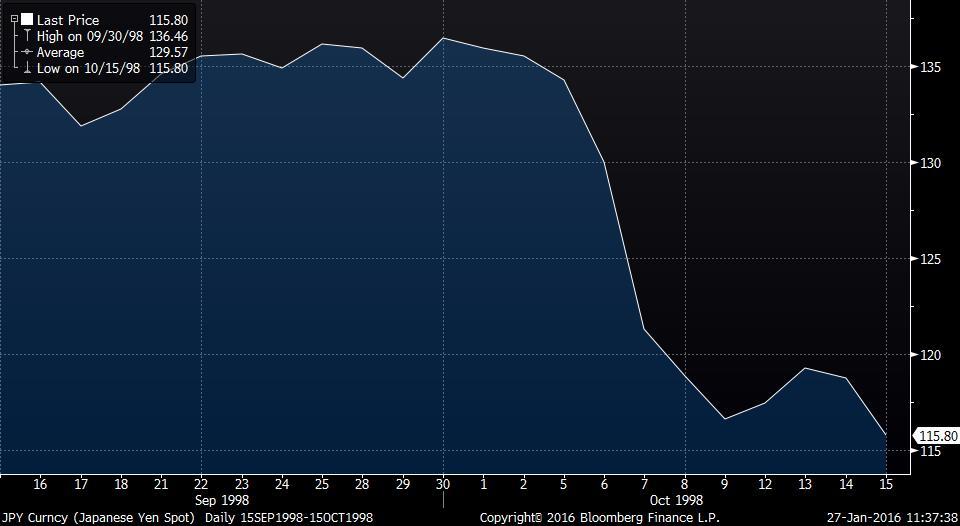
Yen - 9/15/1998 to 10/15/1998                 Source: Bloomberg
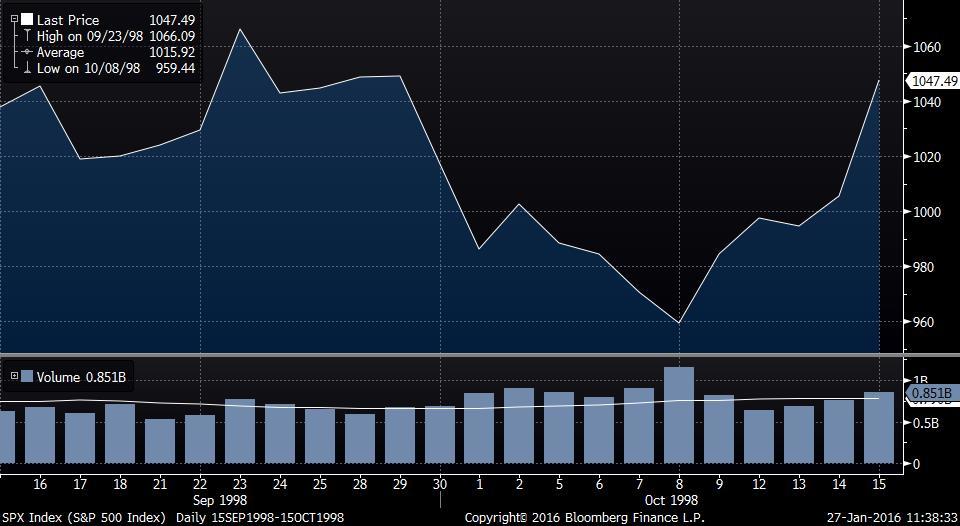
S&P 500 - 9/15/1998 to 10/15/1998           Source: Bloomberg

From the data, we know that the single day $2B loss probably occured on 10/7 to 10/8, when the Yen/$ moved from Y130.03 to Y121.3, a strengthening of Y8.73 (-6.71%), while the SPX went from 970.68 to 959.44 and lost 11.24 (-1.1%).

Looking at the 9/23/98 to 10/7/98 period, Yen/$ went from Y135.63 to Y130.03, strengthening by Y5.6 (-4.13%), apparently losing $2.1B for Tiger.  In this period the SPX was also selling off, losing 95.41 (8.95%), from 1066.09 to 970.68.

We do not know specifically that Tiger was invested in the S&P - the SPX is a proxy for US assets.

Solving these simultaneous equations, we deduce that Tiger's position in Yen was approximately $27.98 billion, and position in S&P was approximately $10.55 billion!  This does not make any assumptions about leverage or changes in leverage, we are just trying to estimate the sizes involved. 

S&P volume was typically around 600mm in the periods prior to this volatility. From 9/23 to 9/30, SPX volume increased to around 700mm, and from 10/1 to 10/7 was between 700mm to 800mm. On 10/8/98, SPX volume spiked to 1.159B shares. 

Between 10/7 and 10/8, 250,800 extra shares of the SPX traded over the prior days, with an 11.24 point decline for the day. Those shares had $2.818B realized loss on the SPX, on an invested amount of $243BB.

The jumps in volume suggest that Tiger and other similar funds were responsible for a significant percentage of the volume in the stock market in that period.  This period also revealed other "Macro" funds that were playing in this trade, when their losses came to light. 


Given that there were many other large "Macro" funds also investing in this period, I am standing by my opinion that the asset rally in the US from 1994 onwards was fueled by the Yen Carry Trade, and not by anything else Mr. Greenspan or the President might have attributed it to, such as a "New Economy".

And all economists that proclaimed that "the state of macro is good" or that "the central problem of depression-prevention has been solved" were dead wrong, as were their critics; in fact, Macro Economics had failed, and the problem was really simpler than one can imagine.


Yen Carry and the Stock Market

From the graph below, as well as the Samurai bond graph above, it is clear to see that, post 1994, as the Yen weakened, along with Samurai Bond issuance, the SPX rallied. The Yen strengthening after the Russian Crisis should have normally been a negative for Samurai issuance. Instead Samurai Bond Issuance picked up, since the Yen strength was offset by an increase in the Fed Funds rate, as well as the start of QE in Japan - this subtlety is captured by the YCI. As a result, the SPX resumed its rally in 1999.


Source: Bloomberg, MBS Mantra, LLC

1999 to the Present: The Yen and Dollar Carry Trades

Starting in 1999, BOJ's Call rate was close to zero, starting a decade of Zero Interest Rate Policy or  "ZIRP".  The BOJ also started deploying QE, adding more potential capital that could be exported.

In addition, "Mrs. Watanabe", the  legendary Japanese housewife, also started trading Yen for other currencies,  notably Aussie$ and US$, for yet more Carry Trades. This is discussed in previous Crisis Notes; I have not managed to identify data that captures the 'Watanabe flows' that are usually quoted by journalists to be over $1T; I suspect the Shah Carry Indicator's precision will improve even more once I do so.  

Between Yen borrowing by banks, Samurai Bonds, Japanese QE, and Mrs. Watanabe, the Yen Carry Trade continued to fund the world, and especially the US.  As Japanese money supply increased, along with Japanese M3, it searched far and wide for investments that would earn more than Japanese Assets. Thus began the phase that led to the Global Financial Crisis ("GFC") - after the supply of available investments was exhausted, assets were being created (notably Subprime and CDOs) to feed the voracious appetites of Carry Traders, further leveraged by Basel rules

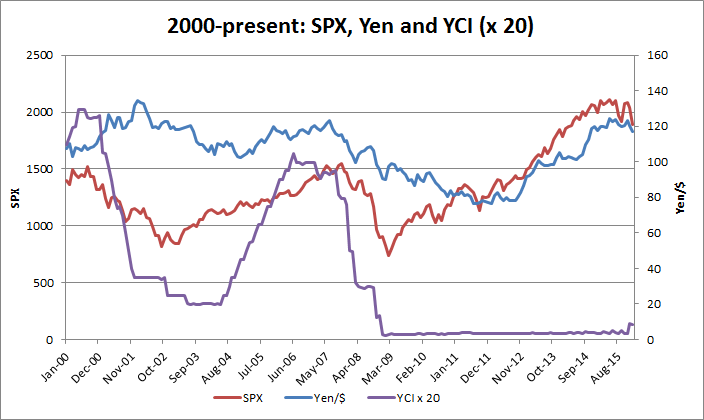
In addition, the US Dollar Carry trade started in earnest after 9/11/2001, as the Fed cut rates from 2001 to 2004.  During this period, it possibly dominated the Yen Carry Trade, reducing the Yen's correlations to US assets and stocks.  When the Fed raised rates again in 2004, the Yen once again became the dominant supplier of capital to the US.


Source: Bloomberg, MBS Mantra, LLC

The Yen Carry Trade continued unabated until US Asset prices started collapsing in 2007.  

In 2008, the Fed also started using QE, in addition to cutting rates again in 2007, once again triggering Dollar Carry, much of it to the Emerging Markets (discussed in this Crisis Note).

The Yen Carry Trade Indicator (YCI) will be a less effective measure for this period due to the additional sources of Carry, from both Japan and the US, and marginally the ECB.  Since Japan has been in ZIRP for a long time, the YCI resembles the Fed Funds Rate. After 2009, when the US cut rates to Zero too, the YCI also went to zero.

There was some Samurai bond issuance after the YCI went to zero. This was primarily from financial institutions that had been bailed out. US markets and investors were still in shock, or wanted to export capital to EM for higher yields, whereas it appears that Japanese investors were still willing lend to US financials, who borrowed money where they could. (For more details, see the Samurai Bond Note).

As you can see from the second graph below, Carry from Samurai bonds alone does not explain the price action of the US Stock market, although there is a link.

Source: Bloomberg, MBS Mantra, LLC

Source: Bloomberg, MBS Mantra, LLC


Quantitative Easing (QE) and Central Bank Balance Sheets

Quantitative Easing is considered an 'unconventional' monetary policy, and is used to increase money supply when conventional tools have become ineffective (i.e. rates are at zero).

Wikipedia has a good definition, so I will use it: 

Quantitative easing (QE) is a monetary policy used by central banks to stimulate the economy when standard monetary policy has become ineffective. A central bank implements quantitative easing by buying financial asets from commercial banks and other financial institutions, thus raising the prices of those financial assets and lowering their yield, while simultaneously increasing the money supply.

When US QE was implemented, I discussed why QE cannot work, in the section called 'Bonds are not Assets' in the 2009 Crisis Note 'Excess Assets, Keynes, etc'. However, QE can increase the money supply by the amount of bonds purchased (similar to an addon wing on a car increasing downforce by the amount of it's weight). Without velocity of money, however, this is a pointless exercise, unless the goal is to enrichen banks.

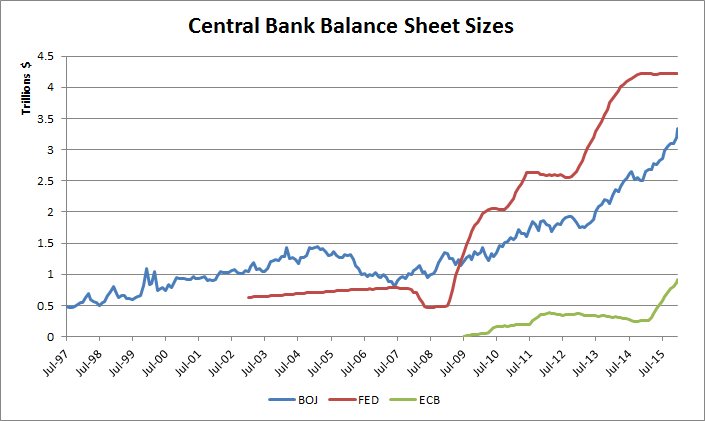
All three major central banks have resorted to QE, at different points in time, after entering Liquidity Traps. The extent of QE that they have implemented can be measured by the size of their (ballooning) balance sheets. The following chart shows the magnitude of their balance sheets (in USD). Combined, they currently total $8.5T, of which approximately $7.5T is as a result of QE.

While the ECB's activities have not been very relevant to US asset pricing to date, Mr. Draghi's recent comments to 'do what it takes' might change the ECB's contribution to Carry Trades and US asset pricing. ECB data is being shown for that reason, and has been incorporated into the Shah Carry Indicator.
Source: Bloomberg, MBS Mantra, LLC
For those interested, the Bloomberg indices were SOMHTOTL, EBBSSECM, and BJACTOTL, in USD

To summarize: 

The Primary Carry Trades are the Yen Carry Trade and the Dollar Carry Trade. They export capital from Funding Countries to Carry Recipient countries, resulting in Asset Price Inflation, via:  

  1. Borrowing in Yen - Funding in Yen through banks, plus short Yen currency trading (Mrs. Watanable)
  2. Lowering borrowing rates by Central Banks
  3. Samurai bonds issuance (as well as EuroYen bonds), leveraging balance sheets of US banks.
  4. Quantitative Easing, allowing funding country banks to export capital through 1 and 3 above.
These have all been incorporated in the Shah Carry Indicator.


Section 2: Carry Trades and Assets

​In this section we will compare the Shah Carry Indicator to a few Assets and economic indicators. 

Please don't expect perfect correlations to all assets - there are other factors at work, such as hedge/leverage ratios that move with volatility, 

Here is the SCI vs S&P chart again.

Source: MBS Mantra, LLC, Bloomberg, Federal Reserve Bank, Bank of Japan

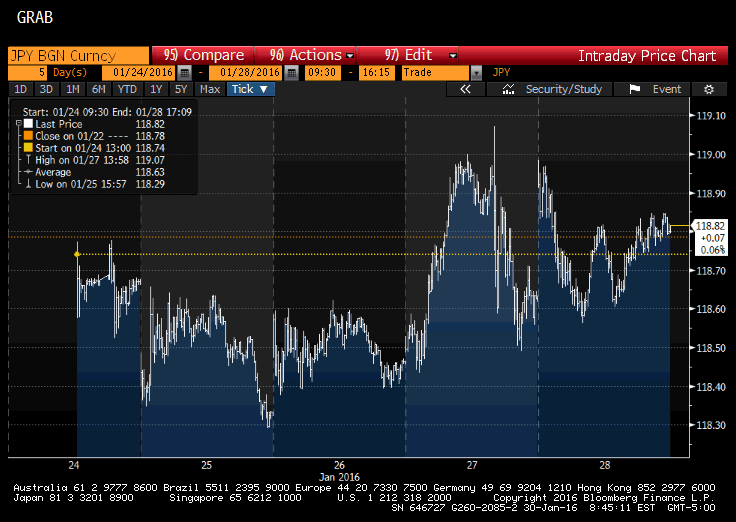
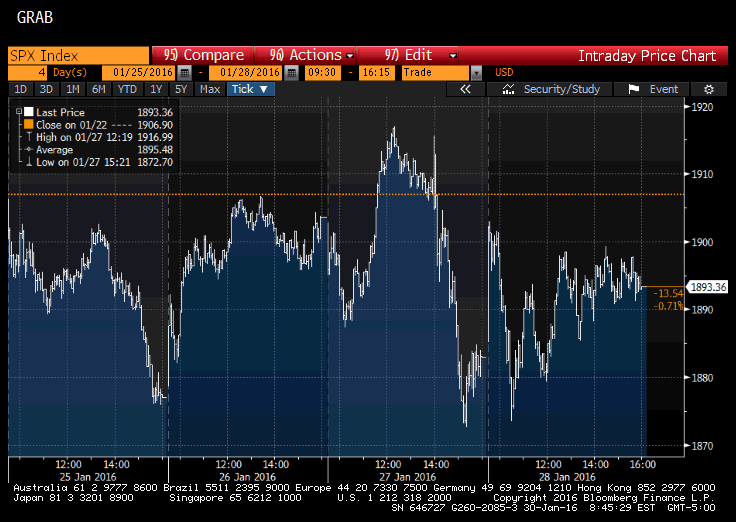
We have already seen the close relationship to the S&P 500 Index above. At the margin however, the Yen alone precisely explains micro movements in the S&P daily, tick by tick, day by day, suggesting to me that the S&P (and the US stock market) is controlled by Program and Algorithmic Trading, using the Yen as the funding and hedging source. 

Yen and S&P intraday

Here is data from last week. Note that you need to make the trading hours the same on Bloomberg if you want to pull up the charts yourself. In previous notes, you'll find some intraday graphs from other periods.

Correlations using daily closing data get lower, possibly because of misalignment of closing prices, or changing hedge ratios in response to changes in the VIX, or maybe other factors.  This is something I will study later to see I can model a hedge ratio more precisely.

Source: Bloomberg, MBS Mantra, LLC

SCI and the S&P 500 Price Earnings Ratio
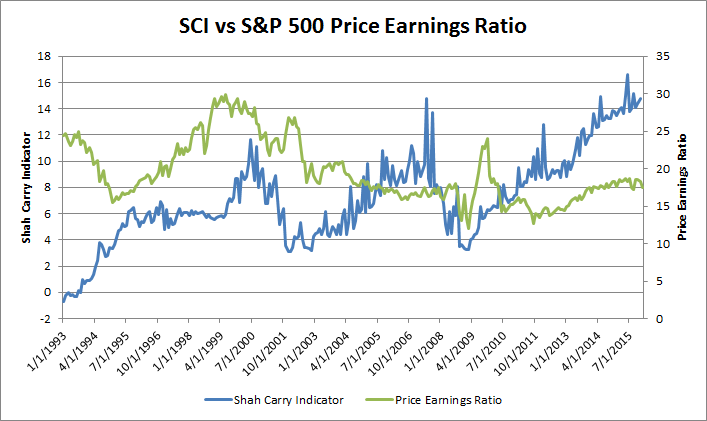
Certainly correlated, but not as well as the Index itself - needs some beta/leverage adjustment maybe? There are studies that suggest that hedge ratios do change with movements in volatility and trend directions. There appears to be some concern in the markets that the current PE Ratios (and the resulting GAP to the SCI) are a result of financial engineering and buybacks of stock, and are limited in their stability, in which case they might come back more in line with the SCI.
Source: Bloomberg, MBS Mantra, LLC


SCI and US Treasury Bonds

Source: Bloomberg, MBS Mantra, LLC

As a bond market participant, I find this very interesting.

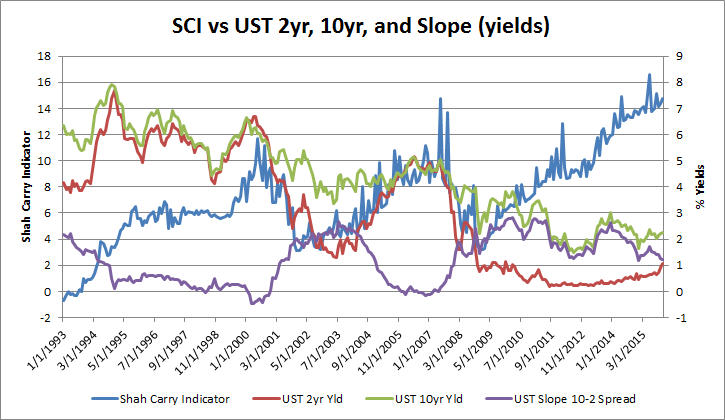
What is remarkable here is that, as the Yen Carry Trade became more popular, especially after 1998 or 1998, and prior to the 2008 Financial Crisis, bond prices, especially the 2 year UST, displayed movements related to the SCI,  i.e. as the SCI went up, so did bond yields, and vice versa.  (Bond prices move inversely with bond yields).

This was counter intuitive to me - I expected that the Carry Trade would have played out in bonds, lowering their yields - people usually think of the Carry trade as being an interest rate arbitrage trade - buy higher yielding assets in another country.

This, to me, suggests the asset allocation Rotation trade: out of bonds into stocks as the stock market rises and vice versa - the market at work allocating resources and capital to the highest returns, with bonds being sold to fund stocks.

Post Crisis, as the Fed became the dominant buyer of USTs for its QE Balance Sheet, bonds prices became more correlated to the SCI (their yields declined as SCI increased).

The Slope too, changed in tandem, suggesting rational duration management and more relative activity in 10s than 2s (flattening during bond rallies, steepening in selloffs).


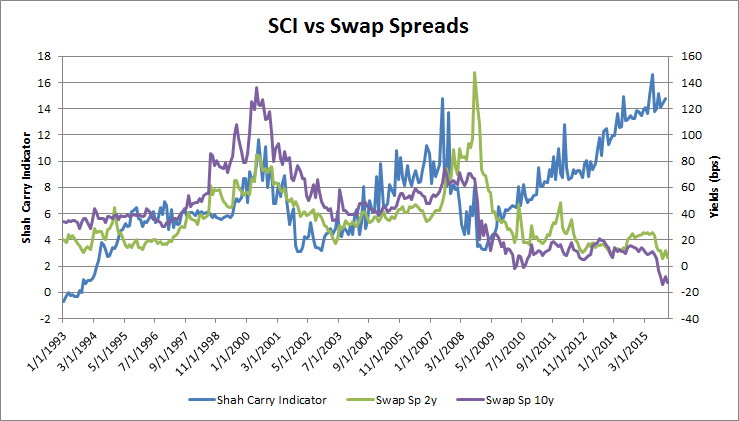
SCI and Interest Rate Swaps (and LIBOR)
Source: Bloomberg, MBS Mantra, LLC

Another very interesting chart - the SCI is highly correlated with Swap Spreads in the Pre-GFC period! I attribute this to the data seen in the prior UST chart - selloffs in rates due to substitution into  Stocks widen Swap Spreads, as credit bonds get sold at the same time. More Asset Allocation at work, and further proof that Carry funds Stocks more than Bonds! 


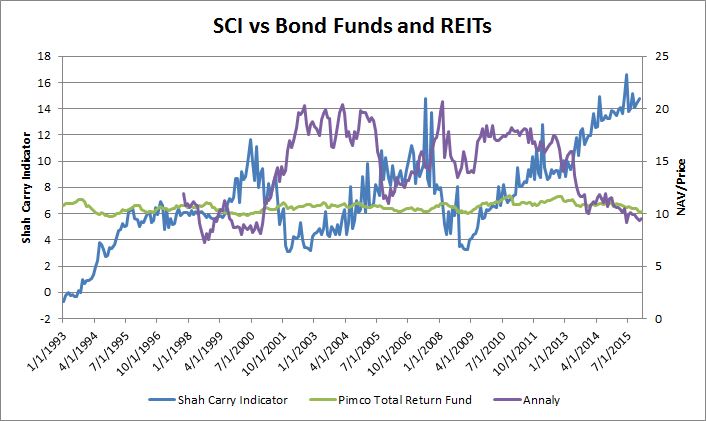
SCI and Bond Funds and REITs
We will use the PIMCO Total Return Fund (PTTRX) and Annaly (NLY) stock as proxies.
Source: Bloomberg, MBS Mantra, LLC

NLY was mostly correlated with interest rates, and inversely with Carry, until 2005. PTTRX also has similar gross movements, but due to the tight scale and limited volatility (lower leverage than NLY), is not as visible. On Bloomberg you can execute {NLY Equity PTTRX Equity HSP <GO>} and change the dates for more scale.

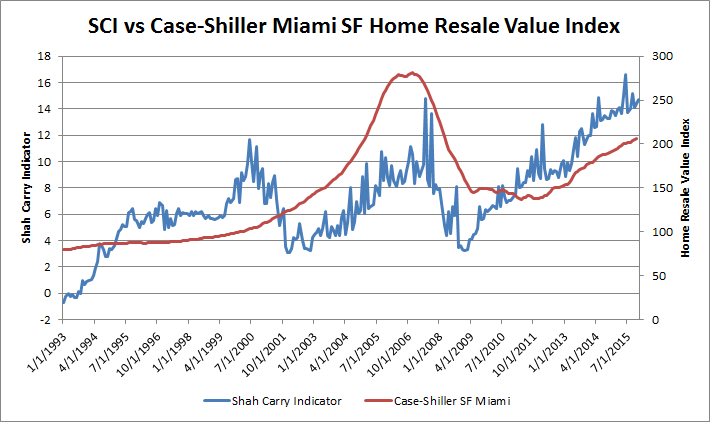
​SCI and Housing

Apologies to anyone in living in Miami. I chose Miami Single Family Home prices as an example of Carry driven housing assets.

Source: Bloomberg, MBS Mantra, LLC

Anyone see subprime or the housing bubble here?  And post the Great Financial Crisis ("GFC"), the subsequent Private Equity funded Single Family Rental asset class? Prior to 2003, it seems people actually bought house to live in them!


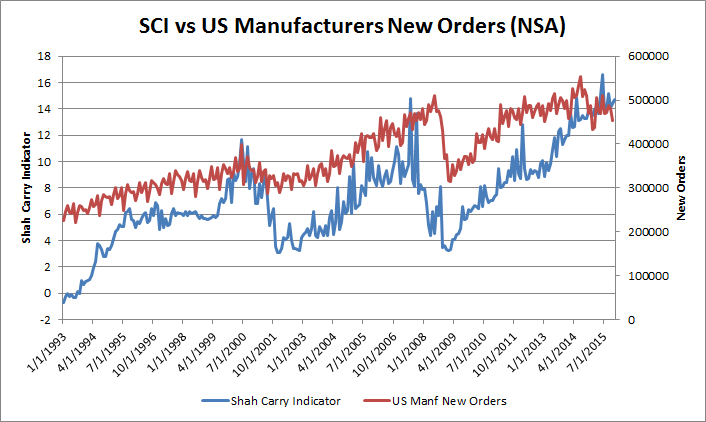
SCI and US Manufacturers New Orders

Yup, Carry drives Manufacturing.

Source: Bloomberg, MBS Mantra, LLC

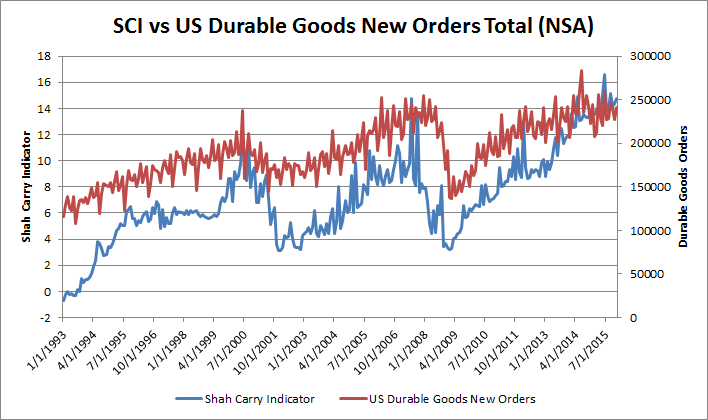
SCI and US Durable Goods New Orders

Ditto.
Source: Bloomberg, MBS Mantra, LLC

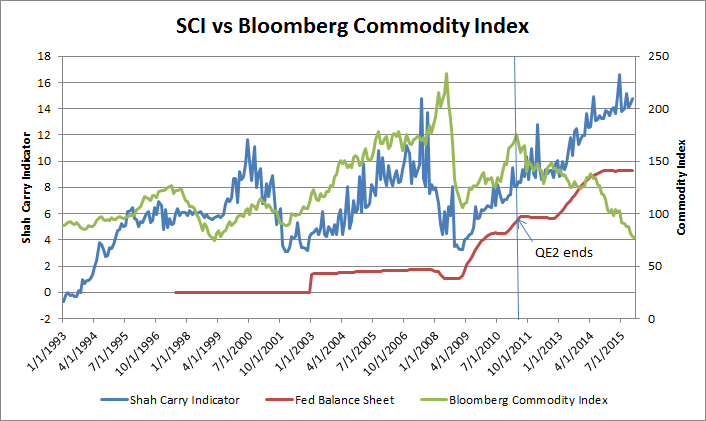
​​SCI and Commodities

The Commodity markets appear to follow the SCI quite well, but started diverging and falling in September 2011. This coincides with the end of QE2! 

Did the commodity traders realize something about demand and the economy that the stock markets traders did not? There is certainly a divergence. This merits further investigation. 
Source: Bloomberg, MBS Mantra, LLC

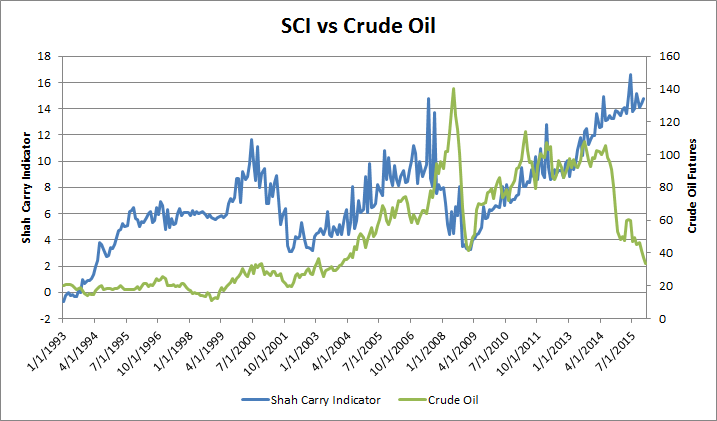
​​SCI and Crude Oil

Not surprisingly, SCI explains most of Crude Oil's price history. One might argue that Carry (via the High Yield and CLO markets) gave the industry the capital to develop shale in the US, leading to the current price collapse. It is instructive to remember that Oil was at $20 before the Carry Trade started, and for most of the 1990s.

Oil and commodities in general above seemed to have started declining when QE3 was implemented, around September 2011.  These markets seem to have taken Bernanke at his word, and commodities have sold off since then.

"The weak job market should concern every American. It imposes hardship on people.."
Source: Bloomberg, MBS Mantra, LLC

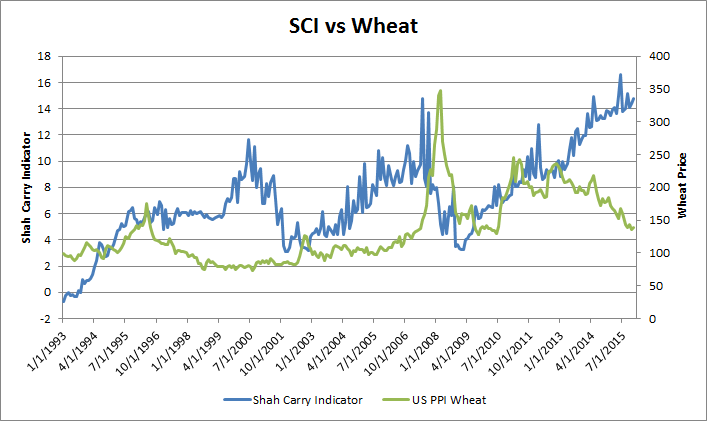
​​SCI and Wheat

I tested the SCI against wheat, as the US is the third largest producer of wheat in the world, and largest exporter, exporting almost 50% of its production. (Source: Wikipedia). If there is a product that should be immune to currency flows, it seems that it should be wheat.  

Source: Bloomberg,MBS Mantra, LLC


Section 3:  Carry Trades, Money Supply and Macro Economics.

This is going to be a slow moving section, layout out the basics and relationships before getting into analysis.

Monetary Policy

Central banks mostly attempt to manage money supply in order to control prices and inflation.  Some central banks have other mandates, such as employment targets and currency management, but the tools used are similar.

The ECB has put up a nice chart describing the Transmission of Monetary Policy.  

In a prior Crisis Note, I have summarized the Bank of England's white paper titled 'The Transmission of Monetary Policy', which gives a good picture of what central banks are attempting to achieve. Here it is again:

  • - Central banks derive their power from the fact that they are monopoly providers of “high powered” money (base money). THIS IS IMPORTANT TO REMEMBER.
  • - Central banks choose the price (rate) at which they lend high powered money to the private sector.
  • - This official rate is transmitted to other market rates via the banking system to varying degrees, and impacts assets prices and expectations, as well as the exchange rate.
  • - These changes in turn effect spending, savings, and investment behavior, which impacts the demand for goods and services.
  • - Monetary policy works via its influence on aggregate demand in the economy. Monetary policy thus determines the general price level, and the value of money ie the purchasing power of money. (Inflation is thus a monetary phenomenon. )
  • - Changes in the policy rate lead to changes in behavior of both individuals and firms, which when added up over the whole economy generate changes in aggregate spending.
  • - Total domestic expenditure in the economy is equal to the sum of private consumption expenditure, government consumption expenditure and investment spending. This, plus the balance of trade (net exports) is equal to GDP.
  • - Monetary policy changes affect output and inflation, as well as inflation expectations. - Inflation expectations influence the level of real interest rates and so determine the impact of any specific nominal interest rate. They also influence price and money wage setting, and so feed into actual inflation in subsequent periods.
  • - Money supply plays a role in the transmission mechanism of policy, but is not a policy instrument nor a target, as the central bank has an inflation target, and uses monetary aggregates as indicators only.
  • - There is a positive relationship between monetary aggregates and the general level of prices. - “Monetary growth persistently in excess of that warranted by growth in the real economy will inevitably be the reflection of an interest rate policy that is inconsistent with stable inflation. So control of inflation always ultimately implies control of the monetary growth rate. However, the relationship between the monetary aggregates and nominal GDP ..appears to be insufficiently stable (partly owing to financial innovation) for the monetary aggregates to provide a robust indicator of likely future inflation developments in the near term.”
  • - Shocks to spending can have their origin in the banking system, that are not directly caused by changes in interest rates
  • – Examples include declines in bank lending caused by losses of capital on bad loans: a credit crunch.
As described in the previous sections above, the tools of Monetary Policy are the Policy Rate, Reserve Requirements, Margin Requirements, and more unconventionally, Quantitative Easing and penalty (negative) policy rates. 


Money Supply

There are a number of measures of Money Supply, depending on the country, from 'narrow' to 'broad'.

  • - M1 is usually a narrow definition - coins and notes in circulation
  • - M2 is typically M1 plus short term bank deposits, savings and checking accounts, money market funds, etc.
  • - MZM - Money Zero Maturity - A measure of the liquid money within an economy. MZM represents all money in M2 less the time deposits, plus all money market funds
  • - M3 is M2 plus longer term deposits.
  • - Some countries have even broader definitions

​Population and Money Supply


Source: Bloomberg, MBS Mantra, LLC


Source: Bloomberg, MBS Mantra, LLC

Source: Bloomberg, MBS Mantra, LLC


Source: Bloomberg, MBS Mantra, LLC

Source: Bloomberg, MBS Mantra, LLC


Source: Bloomberg, MBS Mantra, LLC

Carry Trades in the Press

There has not been much discussion of the Carry Trade in the US press or TV. Various news sources do mention it, but it is so infrequent, that I am not sure how seriously this reporting has been taken. None of seem to quite understand the magnitude and importance it has.

Forbes, on September 4, 2014, finally had an article on Carry trades, to discuss the impact they were having on Emerging Markets. 


Barron's has discussed it many times,  and a google search for "yen carry" finds articles from a few days ago, August 2015,  2006 and 2001. The Barron's articles prior to 2007 had some interesting insights and quotes from prominent hedge funds, but the warnings appear to have gone unheeded.


The Wall Street Journal (WSJ) had a primer in 2007 (that I missed at the time), 
followed by this in 2012 - Yen Play is Blast from the Past
and some more articles since 2012.

The FT also does periodically refer to it, and David Pilling, the FT Asia Editor, is well aware of it. 

In addition there have been numerous blog postings by a variety of people, so I am not the only one attempting to raise awareness of this issue, even though I discovered it on my own.

Much more discussion of Carry Trades occurred in the 1990s, especially after Tiger Management blew up in 1998 (discussed below). However, most of today’s current market participants, especially in the US, appear to be unaware of it.

Most economists that study the Yen and Japanese Financial Policies do so in the context of why Japan cannot create inflation, Liquidity Traps, Japan's Lost Decade(s), and Japan's fight against Deflation. Very few make the connection to the Carry Trade. For example:


Paul Krugman is an US economist who us a Japan Expert, and he has discussed all the topics listed above, and the Carry Trade, but once again, does not appear to have connected the two.


Prior to 2012, the Yen, or Japan, were rarely mentioned in the Wall Street Journal or on American business TV, or acknowledged by economists, displaying American belief and even arrogance in the American economy being the dominant global economy and being isolated from other global forces, and having its own valuation metrics. As Paul Krugman points out, most economists in the 2000s, including Ben Bernanke, believed the Business Cycle and Macro Economics to be “solved”.

During the Great Financial Crisis, Australian newspapers and economists (especially Gerard Minack) were far more keenly aware of the underlying economic events than American papers and TV. There has been some progress on awareness of Yen (it now shows up on TV sidebars nowadays), with journalists still ignorantly identifying it as a ‘Safe Haven’ on days the markets are selling off, as opposed to THE cause for movements in US Stock markets.


Samir Shah, 01/20/2016